 The Minneapolis-St. Paul metropolitan area is a national leader in finance, advanced manufacturing, agriculture and retailing.
Medical devices, electronics and processed foods are strong suits recognized globally.
Want the freshest data delivered by email? Subscribe to our regional newsletters.
8/24/2017 10:09:32 AM
Tim O'Neill
With new population and labor force estimates, unemployment rates, wage data, and industry trends, the Twin Cities regional profile has recently been updated for 2017. These comprehensive profiles include a wealth of demographic, labor market, and economic information on the Twin Cities region.
At the broadest level of analysis, the major developments in the Twin Cities region can be summed up nicely in one word: growth. The region's population is growing, the labor force is growing, international immigration is growing, wages are growing, industry employment is growing. You get the picture. Accounting for over half of Minnesota's total population, and over 60 percent of total employment, the Twin Cities metro continues to be the driving force for growth in the state. And the region continues to grow despite an aging population and a tight labor market.
The Twin Cities metro gained over 27,600 people between 2015 and 2016. This 0.9 percent rate of growth was slightly faster than the state's rate of growth, at 0.7 percent. As such, the metro area accounted for about 74 percent of Minnesota's total population growth over the past year. Zooming into the seven metro area counties, Carver (+1,652 people; +1.7%) and Scott County (+2,067 people; +1.5%) witnessed the fastest growth during that period, while Hennepin County (+12,024 people; +1.0%) enjoyed the largest amount of growth.
Between 2014 and 2016, the number of people 65 years of age and older in the metro increased by 18.2 percent. In addition, those between the ages of 55 and 64 years grew by 10.9 percent, while all younger age groups expanded by less than two percent.
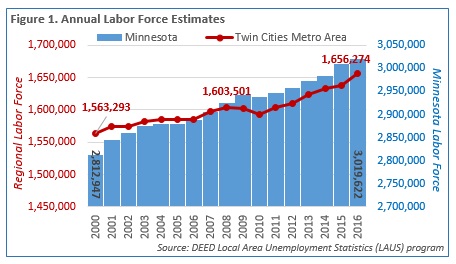
As the Twin Cities metro population ages, labor force growth is being greatly affected. Between 1996 and 2006, the region's labor force grew by an annual average of 0.7 percent. This was roughly equivalent to 10,200 additional people in the labor force every year. Between 2006 and 2016, this growth rate slowed to an annual average of 0.4 percent, or about 7,000 people every year. Interestingly, however, the region's labor force added over 18,700 workers between 2015 and 2016, a growth rate of 1.1 percent (Figure 1).

The Twin Cities metro's aging population and decreasing labor force growth have already begun to affect the demand for workers. Job Vacancy Survey results have posted record high number of openings for the past two years, leaving only about 1 unemployed job seeker for every job vacancy. Along with increased vacancies, total employment continues to build as people fill available jobs. In fact, the metro area surpassed 1.7 million jobs for the first time in 2016, with a gain of over 26,500 jobs (1.6% growth) between 2015 and 2016. While Hennepin County continued to lead the metro for employment growth, Scott County became a surprise leader by jumping 6.1 percent between 2015 and 2016, while Washington County continued to be at the top as well, growing by 3.3 percent.
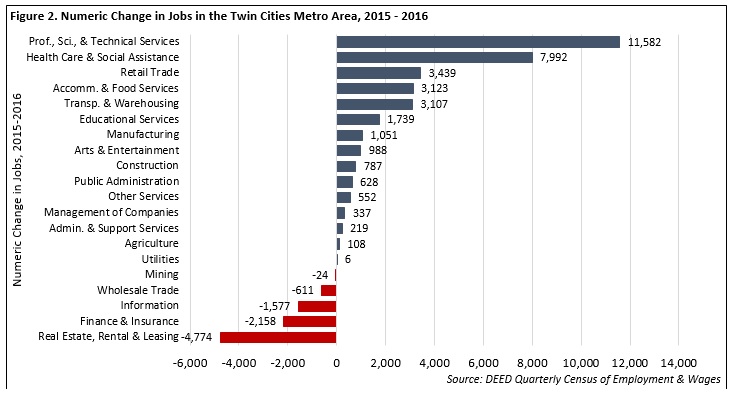
At the industry level, Professional and Technical Services pushed by Health Care and Social Assistance as the region's number-one growing industry sector by adding nearly 11,600 jobs between 2015 and 2016, expanding by 10.3 percent. Health Care and Social Assistance added about 8,000 jobs, growing by 3.2 percent, and is still the largest employing industry overall. Meanwhile, Construction employment stabilized over the past year, growing by just 1.2 percent after seeing much faster growth in recent years, while Finance and Insurance and Real Estate all cooled off quickly, declining by 2.0 percent from 2015 to 2016 (Figure 2).

While DEED's Occupational Employment Statistics (OES) tool is not set up to be used as a time series, it should be noted that the median hourly wage across all occupations increased from $20.79 in 2016 to $21.55 in 2017. The largest jumps in wages were within Building, Grounds Cleaning, and Maintenance; Farming, Fishing, and Forestry; Healthcare Support; and Food Preparation and Serving Related Occupations. Again, these increases are likely due to the region's low unemployment and record vacancies, as well as rising minimum wage levels.
Contact Tim O'Neill at 651-259-7401.