
by Dave Senf
September 2020
Comparison of Minnesota’s labor market indicators over the first six months of the pandemic to those in other states shows that Minnesota’s job market initially deteriorated slightly less than most states. But since then the state’s job market rebound hasn’t been as robust as in many other states. The labor market indicators continue to show that in most states, including Minnesota, the road to recovery will be long and gradual.
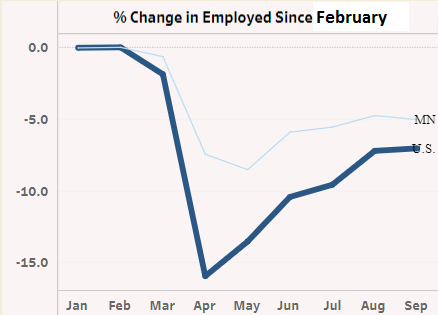
Using household employed data, Minnesota’s employed relative to February dropped to -5 percent in September from -8.5 percent in May. The U.S. relative drop was -7.1 percent in September down from -16 percent in April. So Minnesota’s decrease was less dramatic than the national decrease and Minnesota’s increase in employed from its low point this spring until September has been less than the U.S. increase (chart 1).
Chart 1
Minnesota, along with all states, saw employment plunge, layoffs skyrocket and unemployment soar from mid-March to early May as state governments ordered businesses to close and individuals to stay home in an effort to slow the spread of the coronavirus and to allow healthcare systems to ramp up capacity for treating COVID -19 patients. Many individuals and households had already voluntarily altered their daily routines and spending habits to minimize their chances of catching the virus. And various businesses had also voluntarily shifted normal business practices in order to protect their workers and customers or as demand for their product and services tailed off.
The economic impacts were widespread and speedy, with job market devastation across the nation. Only three states (West Virginia, Alabama, and Missouri) managed to avoid setting all-time unemployment rate records during the pandemic. Most states hit record-high unemployment rates in April. Delaware, Connecticut, and Minnesota reached the unwelcome record-high rate in May while Massachusetts recorded its record high rate in June.1
States started to gradually loosen widely varying levels of business restrictions and stay at home orders in late April through May. The economic reopening paths of states have consequently differed in timing and scope especially as COVID-19 cases have surged and ebbed at various rates and times across the country. Economic disruption and job losses have predictably varied due to business restrictions, numbers and timing of COVID-19 cases, and variation in the industrial composition in states.
States and regions that depend heavily on tourism have been more vulnerable to the labor market impacts of COVID-19 since tourism-related businesses, such as casinos, accommodations, amusement parks, eating and drinking places, museums, concert halls and theaters, and airlines involve in-person contact. These industries have suffered the most job loss from shutdowns, subsequent social distancing requirements and changes in personal habits.
Nevada and Hawaii have been two of the hardest hit states as their economies are heavily dependent on travel and tourism. States with relatively low employment in hard-hit industries, such as Nebraska and South Dakota have experienced smaller jumps in unemployment (see the Nonmetro Versus Metro Minnesota Pandemic Job Effects sidebar for information on how urban and rural regions of the state have been impacted by the pandemic.)
In Minnesota pandemic-related job loss has been more concentrated in urban areas than in rural areas as shown by the aggregated labor market indicators.2 Unadjusted unemployment in the 26 metro counties in August stood at 7.6% or 4.4 percentage points higher than in March. In the 61 nonmetro counties, unadjusted unemployment was 5.6% or 1.0 percentage points higher than in March. This disparity is due in large part to rural areas having a higher concentration of less-impacted industries as well as more agricultural activity than urban areas.
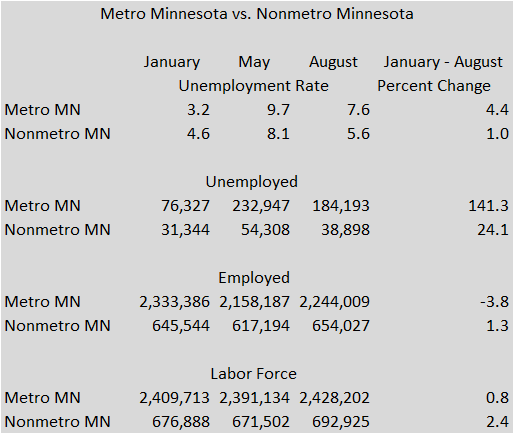
There were 141% more unemployed workers in metro Minnesota in August than in March compared to 24% more in nonmetro Minnesota. Nonmetro Minnesota employment was 1.3% higher in August than in March while down 3.8% in metro Minnesota during the same period. The unadjusted labor force was slightly higher in both metro and nonmetro Minnesota in August than in March.
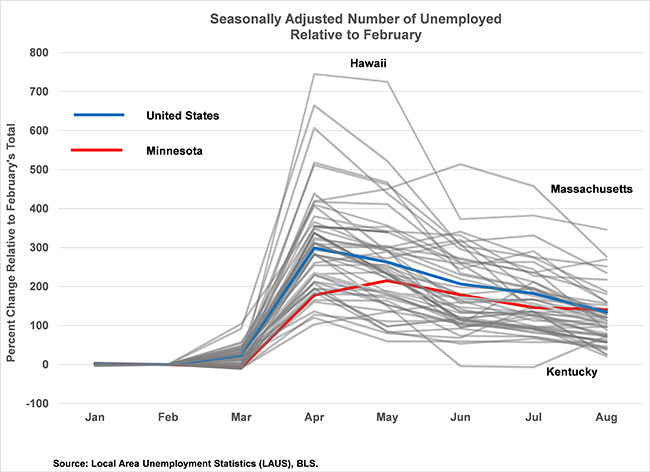
Figures 1 – 6 present six seasonally adjusted labor market measures for all states and the U.S. from January through August (U.S. indicators are highlighted blue while Minnesota is highlighted in red). The figures are snapshots of an interactive Tableau visualization which allows readers to explore how each state’s job market has been impacted by the virus relative to other states and the nation over the last six months.3
Figure 1
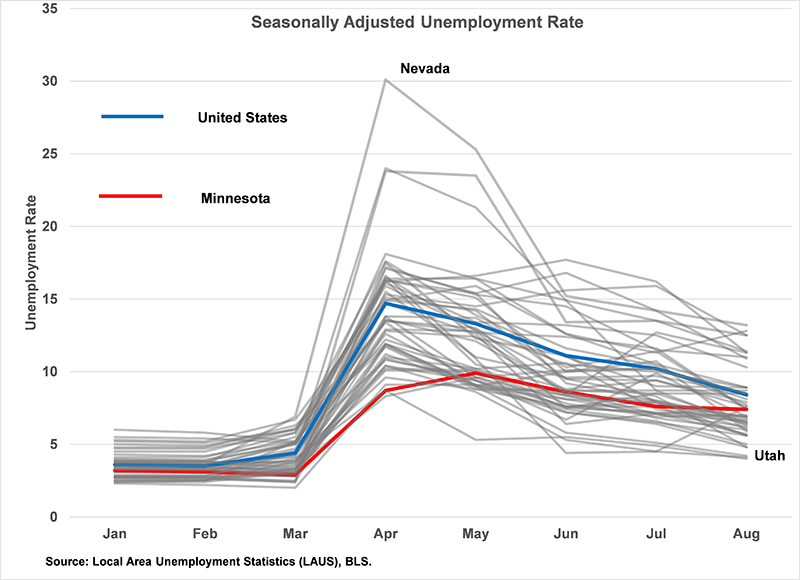
Figure 2
The wide divergence in how the pandemic has impacted job markets across the nation is evident in the spread of state unemployment rates in April compared to March (Figure 1). Unemployment rates in March were between 2.0% (ND) and 6.9% (NV). In April rates ranged from 8.3% (CT) to 30.1% (NV).
Minnesota’s rate increase was less than most states but has been slower to drop over the last few months primarily because Minnesota’s labor force hadn’t decreased. Minnesota’s rate was the second lowest in April and the 29th lowest in August. Minnesota’s rate was 4.3 percentage points higher in August than in February which ranks as the 19th highest February-to-August unemployment increase. Minnesota had roughly 96,000 unemployed workers in February but by May the number had more than tripled to 303,000 (Figure 2). However, thirty-two other states had higher February to May increases in unemployed workers. By August the number of unemployed workers had dropped to 232,000 or 2.4 times the number in February. Only 14 states had a higher percent increase in unemployed workers in August relative to February than Minnesota. Minnesota's monthly unemployed workers increase relative to February was higher than the U.S. for the first time in August.
Figure 3
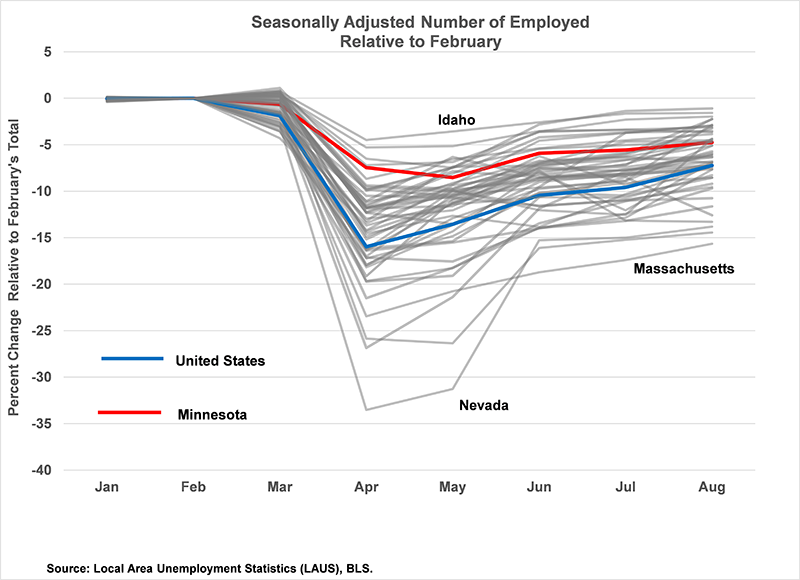
The number of employed workers in Minnesota dropped by 238,000, or 8.5%, from February to May which was the 12th lowest percent decline among states (Figure 3).
Employed workers in the state have increased by 114,500 between May and August leaving the state 4.7% below its February total. Minnesota had the 19th smallest February-to-August decline.
When comparing unemployment rates and the number of unemployed across states, some caution should be used since both measures are affected by other changes in the labor force. If unemployed workers drop out of the labor force the labor force shrinks and the unemployment rate decreases.
Minnesota’s labor force after tailing off 1.7% between February and April has rebounded over the last few months and was only 0.3% smaller in August than in February (Figure 4). The U.S. labor force was 2.3% smaller in August compared to February.
Figure 4
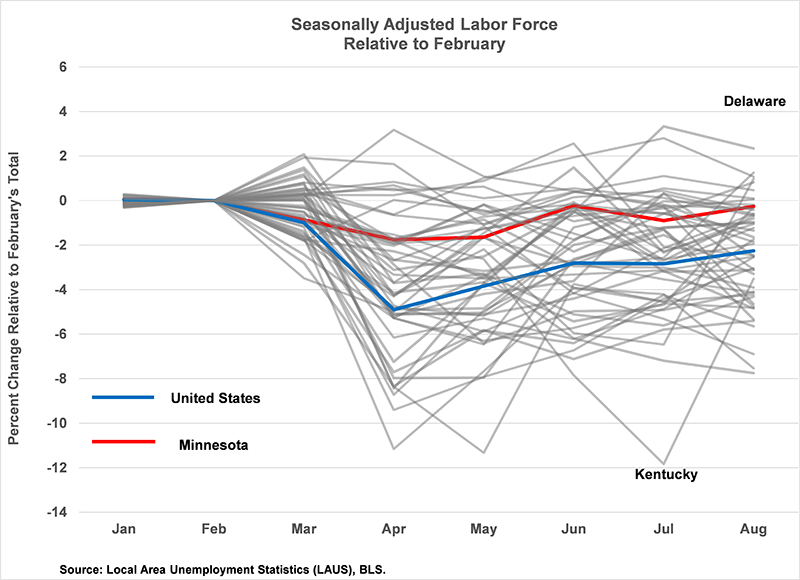
Eight states had slightly larger labor forces in August than in February. All the rest of the states have seen their labor forces contract. Minnesota’s February-to-August labor force change ranks as the third smallest decline.
Figure 5
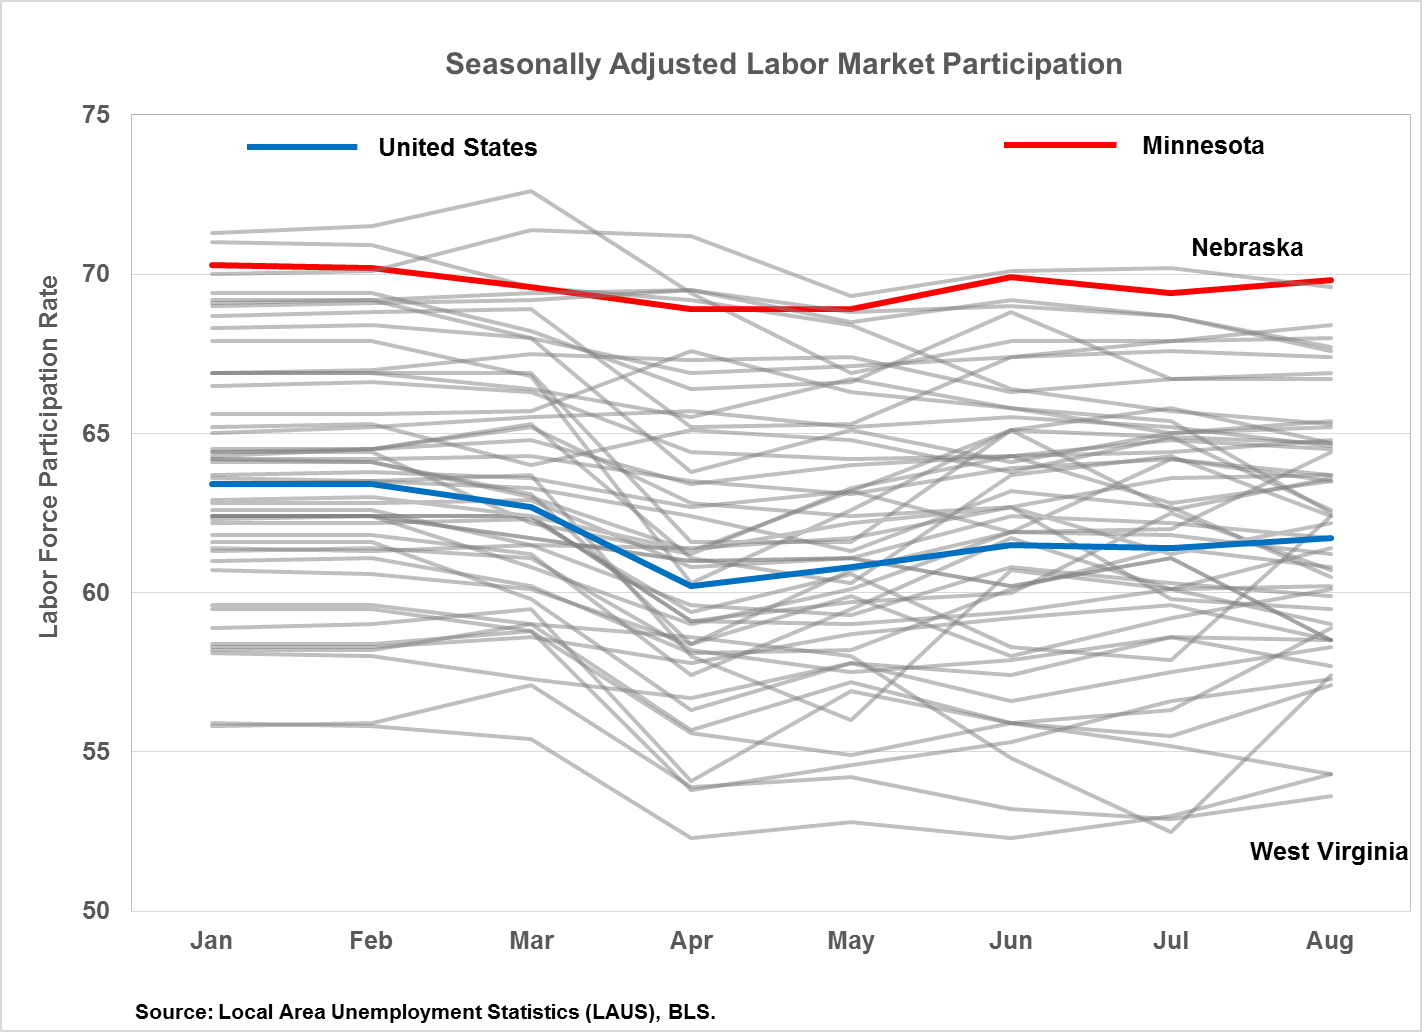
Iowa’s labor force dropped by 7.6%, Wisconsin’s and North Dakota’s by 1.9% and South Dakota’s by 1.6%, as of August.
Unemployment rates in states with high labor force declines will likely see their unemployment rates decline slower as jobs rebound because workers who dropped out of the labor force are likely to return as job prospects improve.
Minnesota’s labor force participation rate (Figure 5) and employment-to-population ratio (Figure 6) have historically ranked near the top.
Figure 6
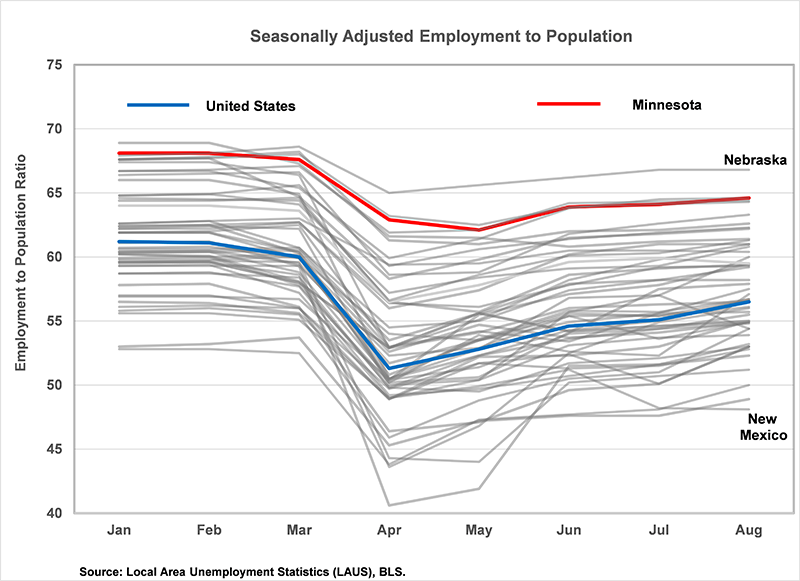
Labor force participation is the ratio of population that is either working (employed) or actively looking for work (unemployed) to the civilian non-institutionalized population 16 years or older. The employment-to-population ratio represents the number of employed workers to civilian non-institutionalized population.
Both of these measures are affected by the age structure and educational attainment of the population and the state of the job market. Tight labor markets tend to increase labor force participation and employment-to-population ratios. Labor markets with populations that are relatively older (think West Virginia) tend to have lower labor force participation rates and employment-to-population ratios while workforces with high educational attainment tend to boost the two measures. Both measures decreased during the first few months of the pandemic but have been rebounding over the last few months.
As the Minnesota labor market continues to recover, it will be important to continue to track Minnesota’s job rebound in comparison to other states. This information will help Minnesota government leaders, workforce development representatives and others know if steps they are taking to connect Minnesota employees who are looking for work with the employers who need them are working as well as in other places.
1All six labor market indicators discussed here are produced by the Local Area Unemployment Statistics (LAUS) program run by the Bureau of Labor Statistics (BLS). Consistent labor market estimates for all states go back to 1976 and are subject to an annual revision. All indicators are based in part on responses to the monthly Current Population Survey (CPS). There are a number of reasons why the CPS may not have done a good job at capturing the full extent of the labor market downturn during the initial months of the current crisis. For more detail on this topic see this article in the June issue of Minnesota Economic Trends.
2The 26 Minnesota counties that are included in metro Minnesota are counties that are part of Metropolitan Statistical Areas (MSA). Minnesota other 61 counties makeup nonmetro Minnesota. The labor market indicators are unadjusted Local Area Unemployment Statistic (LAUS) estimates.