by Derek Teed
April 2018
Manufacturing represents an important part of the Minnesota economy. In 2016 it represented 317,411 jobs or 11.3% of total Minnesota employment. It represented $20.2bn in total wages or 13.2% of the total wages earned in Minnesota. The average wages earned in Manufacturing are 17.4% higher than the average wages earned by Minnesotans. Since Manufacturing represents a core part of the Minnesota economy, it is important to take a closer look at this industry’s recent past, its current performance, and its long-term outlook.
Manufacturing in Minnesota has shown four major trends over the last 17 years:
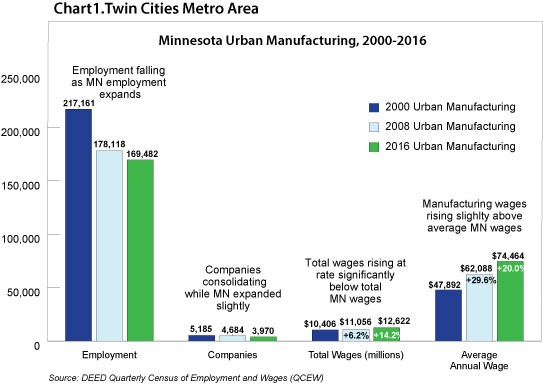
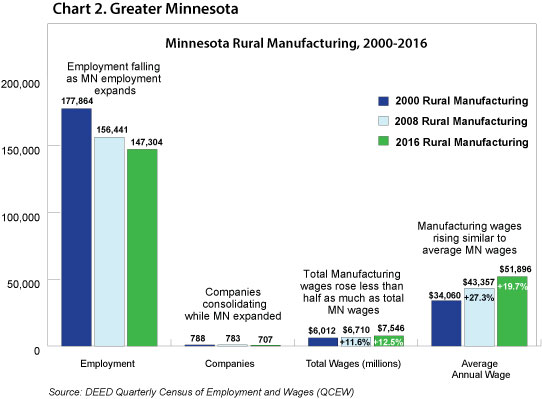
“Manufacturing exports totaled $18 billion with optics and medical equipment as top products and Canada and Mexico as top markets.”2 Canada accounts for $3.80bn in exports, Mexico accounts for $2.20bn in exports, and China accounts for $2.00bn in exports from Minnesota Manufacturers. Minnesota’s top Manufacturing exports are shown in Table 1.
| Table 1. Top Manufactured Exports in Minnesota | |
|---|---|
| Top Manufactured Exports, 2016 | Exports (billions) |
| Optics, Medical | $3.53 |
| Machinery | $3.11 |
| Electrical Machinery | $2.51 |
| Vehicles | $1.49 |
| Plastics | $1.13 |
| Source: DEED, Quarterly Census of Employment and Wages, 2016 | |
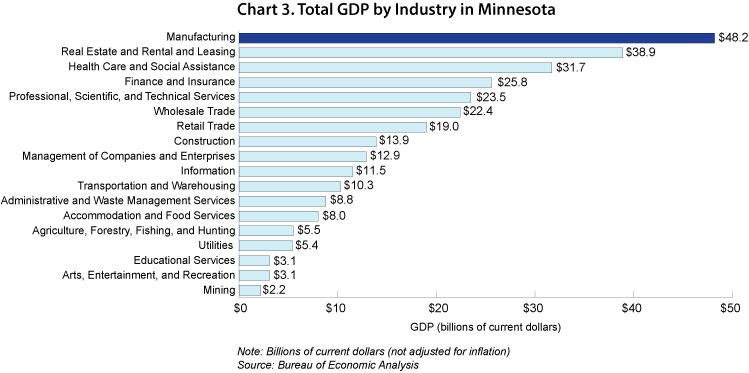
"Manufacturing was the largest private sector contributor to Minnesota's GDP (16 percent) in 2016."3 The GDP of Minnesota's Manufacturing industry in 2016 was $48.2 billion, shown in Chart 3 below.
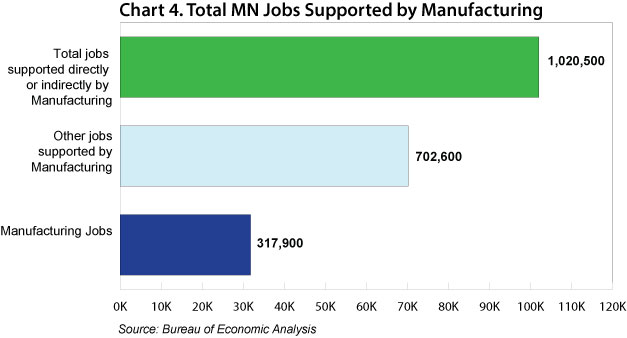
"In all, manufacturing accounted directly or indirectly for 1,020,500 jobs or 36% percent of all jobs in Minnesota in 2016. Each manufacturing job generates another 2.21 jobs in other segments of the economy, like jobs in sales, marketing, shipping, professional services and more."4 The total number of jobs supported by Manufacturing are shown in Chart 4.
In the JVS survey5 shown in Table 2, the manufacturing industry has more openings in Q2 2017 than in any other quarter reported since the Job Vacancy Survey started in 2001. The state of Minnesota has 11,166 manufacturing industry job openings in Q2 2017 compared to 8,122 in 2001 and 2,563 in 2009. Indeed, the short term employment outlook for the manufacturing industry in Minnesota is bright.
| Table 2. Total Minnesota Job Vacancies in the Manufacturing Industry | ||
|---|---|---|
| 2nd Quarter | 4th Quarter | |
| 2017 | 11,166 | 10,105 |
| 2016 | 8,536 | 7,661 |
| 2015 | 7,381 | 7,262 |
| 2014 | 6,954 | 9,905 |
| 2013 | 5,363 | 6,560 |
| 2012 | 5,157 | 5,419 |
| 2011 | 5,961 | 4,925 |
| 2010 | 3,767 | 3,391 |
| 2009 | 2,563 | 1,970 |
| 2008 | 4,685 | 3,047 |
| 2007 | 7,010 | 5,553 |
| 2006 | 7,367 | 5,883 |
| 2005 | 6,477 | 6,792 |
| 2004 | 8,455 | 5,931 |
| 2003 | 4,247 | 5,876 |
| 2002 | 5,093 | 3,650 |
| 2001 | 8,122 | 5,732 |
| Source: DEED, Job Vacancy Survey | ||
The long term employment outlook for manufacturing jobs is mixed. Since the 2000s the total number of manufacturing jobs in the U.S. has been declining. The QCEW figures in Charts 1 and 2 above show that Minnesota has seen a modest decline in manufacturing employment since 2000. The decline in the percentage of total manufacturing employment in Minnesota has been less than in the entire U.S.
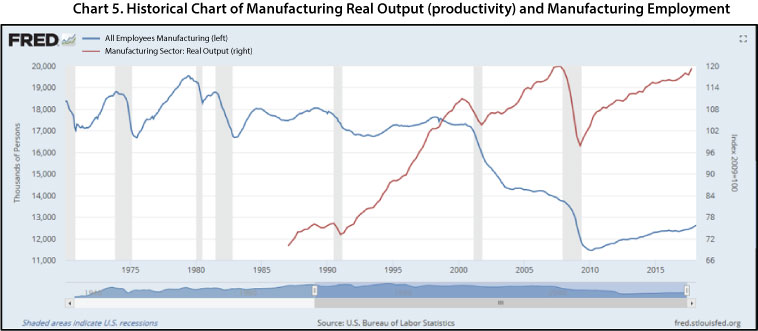
Chart 5 below shows that since 1987 real manufacturing output has increased about 70% while the total amount of employment decreased 28%. This is a result of productivity. If this trend continues, productivity and automation will decrease the total number of manufacturing jobs over the long run.
1Wiseman, Paul. "Why robots, not trade, are behind so many factory job losses." AP News. November 02, 2016. Accessed March 14, 2018.
2Overview of Manufacturing. (2017, November 07).
3Economic Impact. (2017, August 29).
4Ibid.
5Job Vacancy Survey (n.d.) Manufacturing Industry.