by Dave Senf
December 2017
Note: All data except for Minnesota’s PMI have been seasonally adjusted. See the feature article in the Minnesota Employment Review, May 2010, for more information on the Minnesota Index.
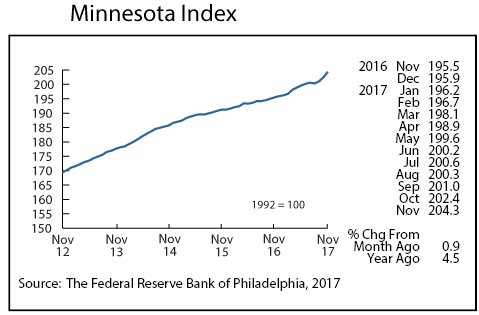
The record monthly increase in the Minnesota Index in October was revised down to a still strong 0.7 percent. November’s gain topped October’s, coming in at a 0.9 percent gain. The index increase over the last two months is the highest two-month jump since late 1983. The index’s advance was again fueled by a decline in the unemployment rate which fell from 3.4 percent to 3.1 percent in November, the lowest level since July 2000.
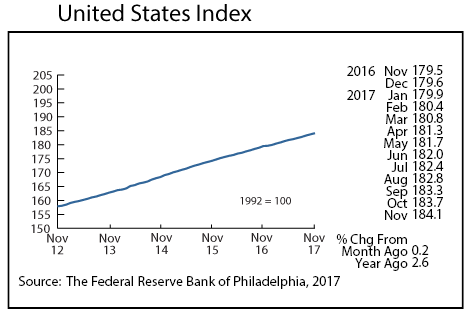
Minnesota’s index was up 4.5 percent over the year which was the highest increase since February 2015. The U.S. index was up 2.6 percent from a year ago. Minnesota’s economy continues to expand at a robust rate, adding jobs at a solid rate and driving the unemployment rate downwards. Minnesota was tied with Tennessee for the 9th lowest state unemployment rate in November.
A consistent gauge of Minnesota’s monthly unemployment rate has been available since 1976. Only 36 months or 7 percent of the 503 months since 1976 have recorded 3.1 percent or below unemployment rates. All the other sub 3.1 percent months were between 1997 and 2000. Extremely tight labor markets like those experienced in the late 1990s seem to be headed to Minnesota in 2018.
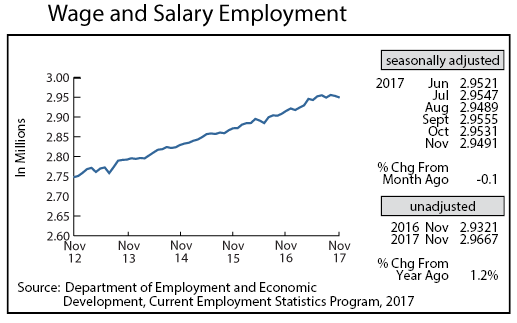
Minnesota’s adjusted Wage and Salary Employment declined for the second month in a row, falling by 4,000 jobs. Most of the job loss was in the private sector which cut 3,400 jobs while public sector payrolls fell by 600 positions. Job loss was heaviest in Leisure and Hospitality and Other Services. Job gains in Trade, Transportation, and Utilities, Professional and Business Services, and Construction helped to offset job loss in other sectors.
Minnesota’s unadjusted over-the-year job growth dropped to 1.2 percent in November which ties April for the lowest over-the-year gain. Unadjusted U.S. job growth was 1.4 percent. Minnesota’s annual average job growth has averaged 1.7 percent through November which is slightly higher than the U.S. 1.5 percent rate.
Minnesota’s 1.7 annual average job growth through November tops all neighboring states which, like Minnesota, are experiencing low unemployment. Annual average job growth through November is 1.1 percent in Wisconsin, 1.0 percent in South Dakota, 0.9 percent in Iowa, and 0.7 percent in North Dakota.
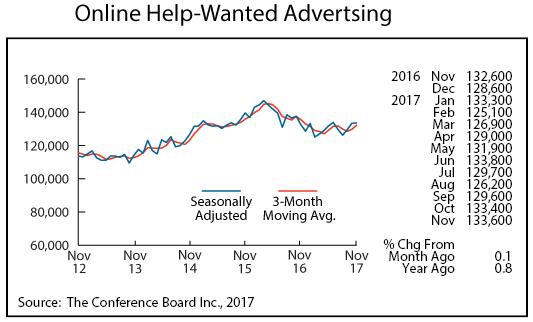
Online Help-Wanted Ads inched up in November to 133,600. Online job postings for Minnesota rose 0.1 compared to 3.0 percent nationwide. Minnesota’s share of U.S. online job ads declined from 2.9 percent last month to 2.8 percent in November.
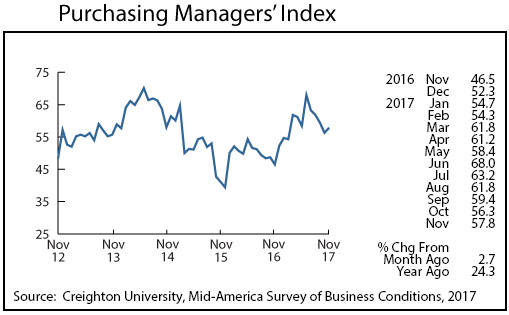
Minnesota’s Purchasing Managers’ Index (PMI), after tailing off for four straight months, climbed in November to a solid 57.8. A reading above 50 indicates expansion in Minnesota’s manufacturing sector while a reading below 50 suggests the sector is contracting. The corresponding national index declined to 58.2 from 58.7 while the Mid-American index dipped to 57.2 from 58.8.
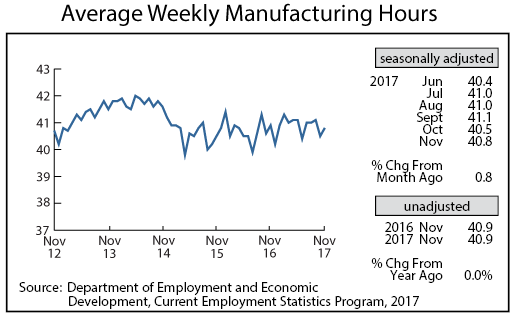
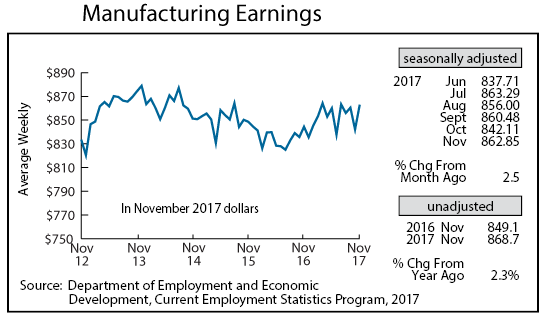
Adjusted Manufacturing Hours rose to 40.8 in November. Annual average manufacturing hours in 2017 will be slightly higher than 2016, a sign that Minnesota manufacturing has been on the upswing this year. Average weekly Manufacturing Earnings bounced upwards to $862.85, a 2.2 percent real increase from a year ago. Annual average factory paychecks in 2017 will be up 2.4 percent from last year after accounting for inflation. Factory paychecks declined in real terms the previous two years.
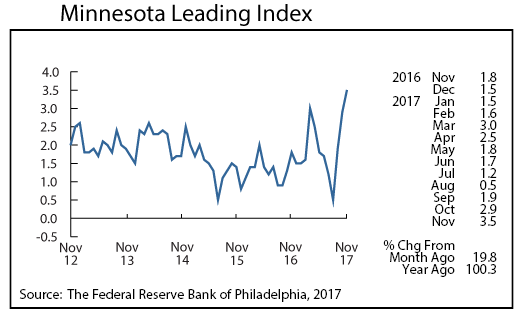
The Minnesota Leading Index surged for the third straight month, reaching 3.5 in November. That is the highest reading since September 2011 and more than double the 35-year monthly average of 1.5. Minnesota’s leading index was the seventh highest, squeezed between California and Utah.
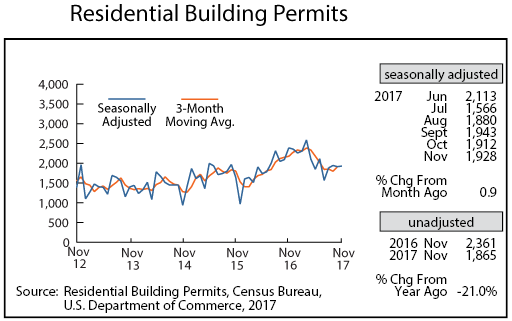
Adjusted Residential Building Permits edged up slightly to 1,928 in November. After averaging 2,202 permits during the first half of the year, permits have averaged only 1,846 during the second half of the year. Home-building permits will be up from last year for the year, but the increase will be down from the 2015-2016 increase.
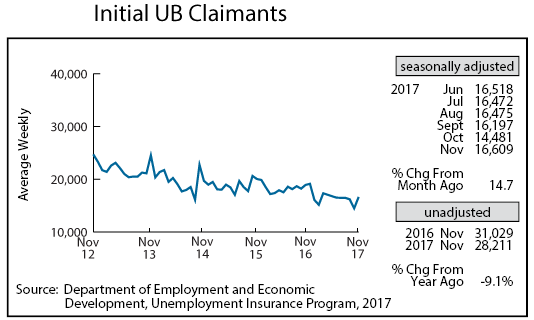
Adjusted Initial Claims for Unemployment Benefits (UB) unexpectedly spiked in November to 16,609. The level of initial claims, which is a proxy for the layoff rate, however, remains very low by historical standards. Unadjusted initial claims were down 9.1 percent from last November.
Initial claims, which peaked at 43,750 in May 2009, have been dropping throughout the slow-but-steady economic expansion which began in June 2009. The expansion is now the third longest on record and will become the second longest in mid-2018, passing the 1961-69 expansion.