By Dave Senf
March 2013
Two sets of data are helping DEED to keep tabs on how employment is shifting by occupation in Minnesota.
DEED has tracked Minnesota employment changes across industries during and after the Great Recession in a relatively straightforward way, using either Current Employment Statistics (CES) or the Quarterly Census of Employment and Wages (QCEW).1
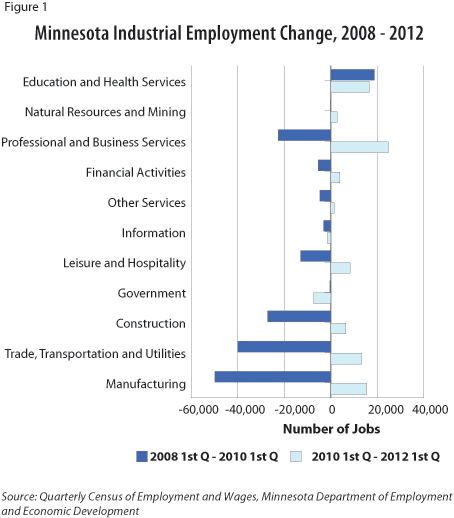
As shown in Figure 1, all but one of the state's 11 major industrial sectors lost jobs or saw little change in employment levels between the first quarters of 2008 and 2010. Educational and health services was the only sector to show healthy job growth during that period.

In the two years that followed, however, all sectors except information and government added jobs. Minnesota lost 147,600 jobs during the first two-year period and recovered 84,300 jobs during the second two-year period. Minnesota business have continued to add workers over the last 10 months. The net result: as of January 2013, the state had regained 90 percent of the jobs that were lost in the recession.2 Some sectors have regained more jobs than were lost during the recession. Other sectors, like construction and manufacturing, remain far below pre-recession levels.
Measuring jobs lost by specific occupation in the recession is not as easy, however.
It is much easier and less costly to get companies, nonprofits and government agencies to report monthly or quarterly total job numbers accurately by industry than to get them to report job numbers by specific occupations regularly. For that reason, Occupational Employment Statistics (OES) - the only occupational employment series published by DEED - are available on an annual basis, rather than monthly or quarterly like the other employment series. OES figures are survey-based with no benchmarking; that is, they are not revised as more accurate information becomes available.
DEED conducts two OES surveys each year, one in May and the other in November. Employment and wage and salary data for about 800 occupations are collected from roughly 2,600 establishments or about 1.6 percent of all establishments in the state.
In order to improve the reliability of the data, the six most recent surveys are pooled together. While roughly 10 percent of all establishments are included in the three years of data used for the survey, nearly 50 percent of all payroll employment is covered. The higher employment coverage is achieved by sampling every business with more than 250 employees during the three-year cycle and all state and federal government agencies once a year.
Despite the limitations of the OES survey, it provides useful information on occupational shifts in Minnesota, especially when used in combination with the American Community Survey (ACS).3 ACS data, available since 2002, are obtained through household surveys that capture both self-employed jobs and wage and salary jobs. OES occupational data does not include self-employed data.
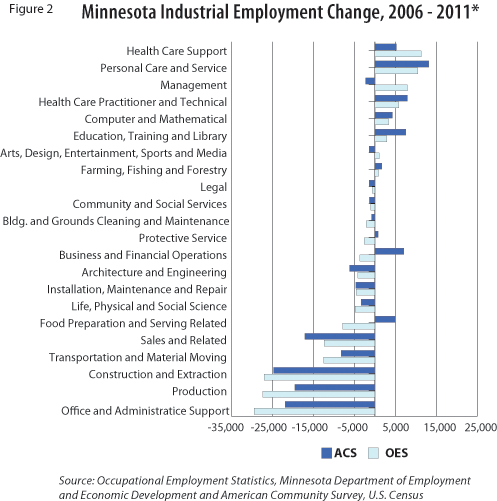
Figure 2 compares the changes in occupational employment between 2006 and 2011 after subtracting self-employed occupational estimates from ACS data to make the two datasets more consistent.4 Self-employment accounts for about 7 percent of total ACS employment, with 60 percent of self-employment concentrated in four occupational groups: management, personal care and services, sales and related, and construction.

The occupational shifts appear to match up pretty well with the sharp shifts in industry employment over the last few years. Construction and production occupations suffered steep declines because of payroll reductions in the construction and manufacturing sectors.
Personal care and service, health care support, and health care practitioners and technical positions, on the other hand, increased hiring in most industries. The deep drop in office and administrative support occupations might be a surprise, but not if one considers those occupations exist in nearly every industry.
OES and ACS data showed contradicting shifts in only five of the 22 groups. The survey-based nature of the data introduces error into the estimates, and both datasets come complete with margin of errors and confidence intervals. To minimize the statistical errors, estimates from each survey were averaged over three years.
The statistical survey errors, however, are not enough to explain large discrepancies in a number of occupational groups. Half of the ACS and OES 2011 occupational group estimates differ by more than 10 percent. For example, ACS estimates that 150,000 Minnesotans worked in food preparation and serving jobs in 2011, while OES estimates 217,000 jobs in that sector.
More research is needed to understand the inconsistencies between the two occupational survey estimates. Clearing up the inconsistencies will improve our understanding of Minnesota's job picture, which in turn will lead to better labor market information.
1Two other sources of employment data are Local Area Unemployment Statistics and Occupational Employment Statistics. For a detailed comparison of the four employment data sources, see the LMI glossary.
2More recent data on the employment levels are available through the Current Employment Statistics program. Quarterly Census of Employment and Wage data are used here to match occupational employment data more closely.
3The American Community Survey (ACS), produced by the U.S. Census Bureau annually, surveys about 70,000 households in Minnesota, or roughly 3 percent.
4In addition to reporting occupational employment across the 22 major Standard Occupation Classification (SOC) groups, ACS estimates are also reported by five class of workers: employee of private company worker, government worker, private nonprofit worker, self-employed in own incorporated business worker, and self-employed in own not incorporated business workers. Self-employed in own not incorporated business estimates were subtracted from total ACS employment.