by Tim O'Neill
June 2019
Keep an eye on population trends and labor force growth while addressing employment disparities.
The seven-county Twin Cities Metro Area is the most-populated and largest-employing region in Minnesota and the gap is growing. Recent population and employment growth outpaced the state's. With this growth comes new opportunities, as well as challenges, for employers and job seekers.
As of 2018, just under 3.1 million people called the Twin Cities Metro Area their home. And since 2010, nearly 250,000 more people have moved into the region, growing 8.5 percent over the past eight years. The growth significantly outpaced Minnesota and the United States, with growth rates of 5.7 percent and 5.8 percent, respectively. Hennepin and Ramsey counties together accounted for three-fifths of the Metro Area's population growth during those eight years. Recent population estimates from the Metropolitan Council1 highlight this with growth led by Minnesota's most-populated cities, Minneapolis and St. Paul. Like the Council's estimates, however, recent Census estimates show rapid population growth in Carver and Scott counties (Table 1). Blaine, Woodbury, Lakeville, Plymouth, Savage and Shakopee are growing rapidly.
| Table 1. Metro Area Population and Employment Trends, 2010-2018 | ||||||
|---|---|---|---|---|---|---|
| Geography | 2018 Population | 2010 – 2018 Population Change | 2018 Number of Jobs | 2010 – 2018 Employment Change | ||
| Numeric | Percent | Numeric | Percent | |||
| Anoka County | 353,813 | +22,377 | +6.8% | 125,509 | +20,190 | +19.2% |
| Carver County | 103,551 | +12,148 | +13.3% | 40,563 | +8,861 | +28.0% |
| Dakota County | 425,423 | +26,217 | +6.6% | 189,417 | +20,549 | +12.2% |
| Hennepin County | 1,259,428 | +105,236 | +9.1% | 928,667 | +124,934 | +15.5% |
| Ramsey County | 550,210 | +40,821 | +8.0% | 333,337 | +17,804 | +5.6% |
| Scott County | 147,381 | +16,870 | +12.9% | 53,933 | +13,340 | +32.9% |
| Washington County | 259,201 | +20,265 | +8.5% | 87,124 | +15,832 | +22.2% |
| Metro Area | 3,099,007 | +243,934 | +8.5% | 1,758,550 | +221,509 | +14.4% |
| Minnesota | 5,611,179 | +300,336 | +5.7% | 2,881,172 | +317,781 | +12.4% |
| Source: Census Population Estimates, DEED Quarterly Census of Employment and Wages (QCEW) | ||||||
Like in Minnesota and nationwide, the Twin Cities population is becoming older. The 2000 and 2017 Census Bureau estimates show that only those age cohorts 55 and older experienced faster growth than the overall population growth.
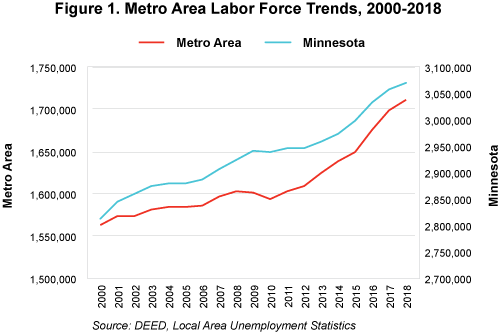
As the region's total population ages, its labor force also ages, resulting in slower labor force growth. During the 1990s, the Metro Area's labor force grew by an annual average rate of 1.5 percent. This slowed dramatically during the 2000s with the Great Recession, dipping to 0.2 percent average annual growth (Figure 1). While labor force growth has rebounded to 0.9 percent average annual growth in the 2010s, projections anticipate this growth will cool off again through the next decade, at an annual average 0.6 percent between 2020 and 2030.2

After declining by 5.3 percent, equivalent to more than 85,600 jobs, the Twin Cities Metro Area's total employment has continuously expanded since the end of the Great Recession in 2010. Specifically, the region has gained over 221,500 jobs in the past eight years, expanding by 14.4 percent. For reference, total state employment expanded by 12.4 percent, equivalent to just under 317,800 jobs. Where the Metro Area accounts for 61.0 percent of the state's total employment, it has accounted for 69.7 percent of the state's total employment growth since 2010.
Health Care and Social Assistance has led the charge in industry growth. Between 2010 and 2018, this industry sector gained over 58,500 jobs, growing by 27.0 percent. This was nearly twice as many jobs gained as the next industry, Professional, Scientific, and Technical Services, which gained just over 31,000 jobs during that time, up 32.0 percent. Coming in third, Construction added nearly 22,000 jobs, up 43.9 percent making Construction the region's fastest-growing industry sector since 2010. Overall, 18 of 20 major industry sectors have gained employment since 2010 in the Metro Area, with only Information and Real Estate and Rental and Leasing dipping into the red. Growth trends have remained largely the same over the past five years as well, with Health Care and Social Assistance, Professional, Scientific and Technical Services and Construction leading the pack between 2013 and 2018.
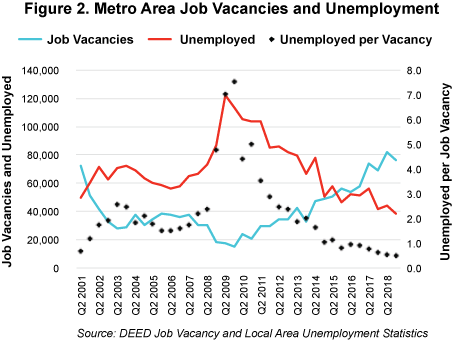
Despite population and labor force growth, the aging labor force, increasing retirements and continued need for workers is causing the Metro Area to experience an increasingly tight labor market. As of fourth quarter 2018, job vacancies in the Metro Area climbed to over 76,500. This represents the most fourth quarter vacancies ever recorded in the history of DEED's Job Vacancy Survey, and second only to second quarter 2018 results (Figure 2).

As of 2018, the unemployment rate in the Metro Area dipped down to 2.6 percent, the lowest annual rate since 1999. During fourth quarter 2018, this low unemployment represented approximately 38,200 persons. When taken together, there was less than one unemployed person (0.5 to be exact) for every job vacancy in the region. Metro Area employers are experiencing challenging labor shortages.
Here are the most vacancies in the Metro Area, by industry level:
Between fourth quarters 2017 and 2018, vacancies increased the most in Administrative and Waste Services; Wholesale Trade; Finance and Insurance; Real Estate and Rental, and Leasing; Management of Companies; Manufacturing; and Transportation and Warehousing.
Analyzing the job vacancy rate is another way of determining labor market demand. This rate is an estimate of the percent of job vacancies relative to all filled jobs in an occupation or industry. Occupations in the Metro Area with both a high job vacancy rate and a high number of total vacancies include: Fitness Trainers and Aerobics Instructors, Landscaping and Grounds-keeping Workers, First-Line Supervisors of Food Preparation and Serving Workers, Combined Food Preparation and Serving Workers, Nursing Assistants, School Bus Drivers, Retail Salespersons, Licensed Practical and Licensed Vocational Nurses, Childcare Workers, Janitors, Personal Care Aides, Applications Software Developers, and Machinists. While there are hundreds of specific occupations in demand in the Metro Area, this list goes to show the wide variety of opportunities available for job seekers, especially in terms of occupational field and educational requirements.
Keeping a close eye on population trends, labor force growth, industry statistics and occupational demand is more important than ever in the Metro Area's current economy. The labor market is strong, given population and industry expansion since 2010. Greater emphasis on the region's robust diversity, as well as reducing employment disparities, will be needed to meet the challenges of a tight labor market.