
by Tim O'Neill and Cameron Macht
June 2021
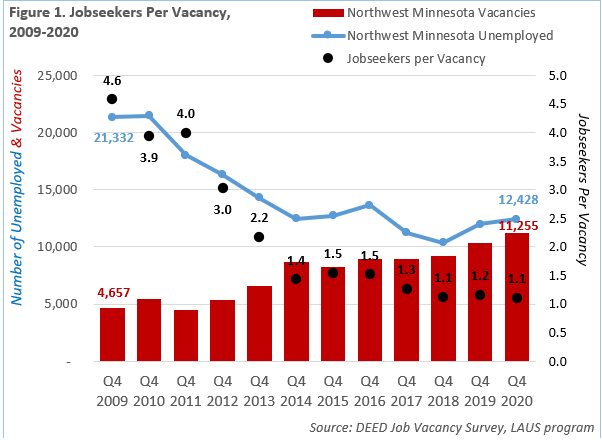
As the regional economy continues to return to normal following the pandemic recession, employers in Northwest Minnesota are in hiring mode again but they're finding a tight labor market. DEED's Job Vacancy Survey from the fourth quarter of 2020 showed 11,255 job openings in the region, which is the fourth highest number on record. When compared to the count of unemployed workers from DEED's Local Area Unemployment Statistics, the region has already returned to a nearly 1-to-1 jobseeker to job vacancy ratio, essentially identical to pre-pandemic times.
This is a very different labor market scenario than what we saw during and following the Great Recession, when there were over 4.5 workers for every job vacancy. Things were tough for workers in 2009 as the number unemployed climbed steadily and remained high due to widespread job loss, while the number of available jobs dropped below 5,000 and hovered around there for the next three years. In contrast, there are many jobs available for workers in the region right now – even above pre-pandemic levels (see Figure 1).

Coming out of the current pandemic recession, with record high levels of demand, employers are looking for workers and often are struggling to find them for a variety of reasons. According to the fourth quarter Job Vacancy Survey results for Northwest Minnesota, the industries that have the most current openings in the region include:
Together, these 5 industries account for nearly 85% of all the vacancies posted in the region. With the exception of Manufacturing, many of these industries are only offering part-time work, and the majority of them are offering wages at or below $15 per hour. In addition, only 58% of all vacancies in the region are offering health insurance benefits, including only 13% in Accommodation & Food Services and 16% in Educational Services, which may be preventing workers from jumping into those jobs. In contrast, just over 75% of job postings in Retail Trade are now offering health insurance, a sign that those employers are willing to offer new benefits to attract more workers.
DEED's Quarterly Census of Employment and Wages (QCEW) data provide a thorough examination of Northwest Minnesota's employment landscape. Averaged across the four quarters of 2020, the Northwest Minnesota planning region had 17,362 establishments supplying 210,740 covered jobs. As such, the region accounts for 7.7% of Minnesota's total employment. Top-employing major industry sectors in the region include Health Care & Social Assistance (38,192 jobs), Manufacturing (27,964 jobs), Retail Trade (26,894 jobs), and Educational Services (21,048 jobs).
The most distinguishing regional industry sectors, which account for a higher share of employment in the Northwest region versus the state as a whole, include Agriculture, Forestry, Fishing & Hunting (23.1% of statewide employment in this sector is in Northwest Minnesota); Public Administration (12.2%); Accommodation & Food Services (10.0%); Retail Trade (9.7%); Educational Services (9.7%); Utilities (9.4%); and Manufacturing (9.0%). Total payroll across all industries in the region equaled $9.5 billion in 2020, with the average annual wage at $45,136 (Table 1).
Table 1. Northwest Minnesota Industry Statistics, Annual 2020 (Sorted by Number of Jobs)
| Industry | Number of Establishments | Number of Jobs | Share of MN Jobs | Total Payroll ($1,000s) | Avg. Annual Wage |
|---|---|---|---|---|---|
| Total, All Industries | 17,362 | 210,740 | 7.8% | $9,517,906 | $45,136 |
| Health Care & Social Assistance | 1,769 | 38,192 | 7.9% | $1,839,685 | $48,152 |
| Manufacturing | 826 | 27,964 | 9.0% | $1,533,303 | $54,756 |
| Retail Trade | 2,314 | 26,894 | 9.7% | $800,042 | $29,744 |
| Educational Services | 384 | 21,048 | 9.7% | $1,000,152 | $47,840 |
| Accommodation & Food Services | 1,532 | 17,783 | 10.0% | $326,342 | $18,304 |
| Public Administration | 725 | 16,078 | 12.2% | $835,978 | $52,000 |
| Construction | 2,295 | 11,532 | 8.8% | $667,879 | $57,408 |
| Wholesale Trade | 614 | 10,958 | 8.8% | $653,815 | $59,644 |
| Transportation & Warehousing | 887 | 6,055 | 5.8% | $272,692 | $44,980 |
| Finance & Insurance | 864 | 5,914 | 4.0% | $367,082 | $62,036 |
| Other Services (except Public Administration) | 1,497 | 5,815 | 7.5% | $154,721 | $26,728 |
| Agriculture, Forestry, Fishing & Hunting | 890 | 5,280 | 23.1% | $241,394 | $45,500 |
| Professional, Scientific & Technical Services | 849 | 4,620 | 3.0% | $260,360 | $56,420 |
| Administrative & Support Services | 666 | 3,802 | 3.1% | $133,783 | $35,048 |
| Arts, Entertainment & Recreation | 396 | 2,749 | 7.5% | $59,346 | $21,684 |
| Information | 246 | 2,431 | 5.2% | $127,478 | $52,416 |
| Real Estate & Rental & Leasing | 451 | 1,501 | 4.4% | $56,505 | $37,648 |
| Utilities | 67 | 1,258 | 9.4% | $116,162 | $92,352 |
| Management of Companies | 51 | 647 | 0.7% | $57,870 | $89,700 |
| Mining | 40 | 216 | 3.9% | $13,319 | $58,864 |
| Source: DEED Quarterly Census of Employment and Wages (QCEW) | |||||
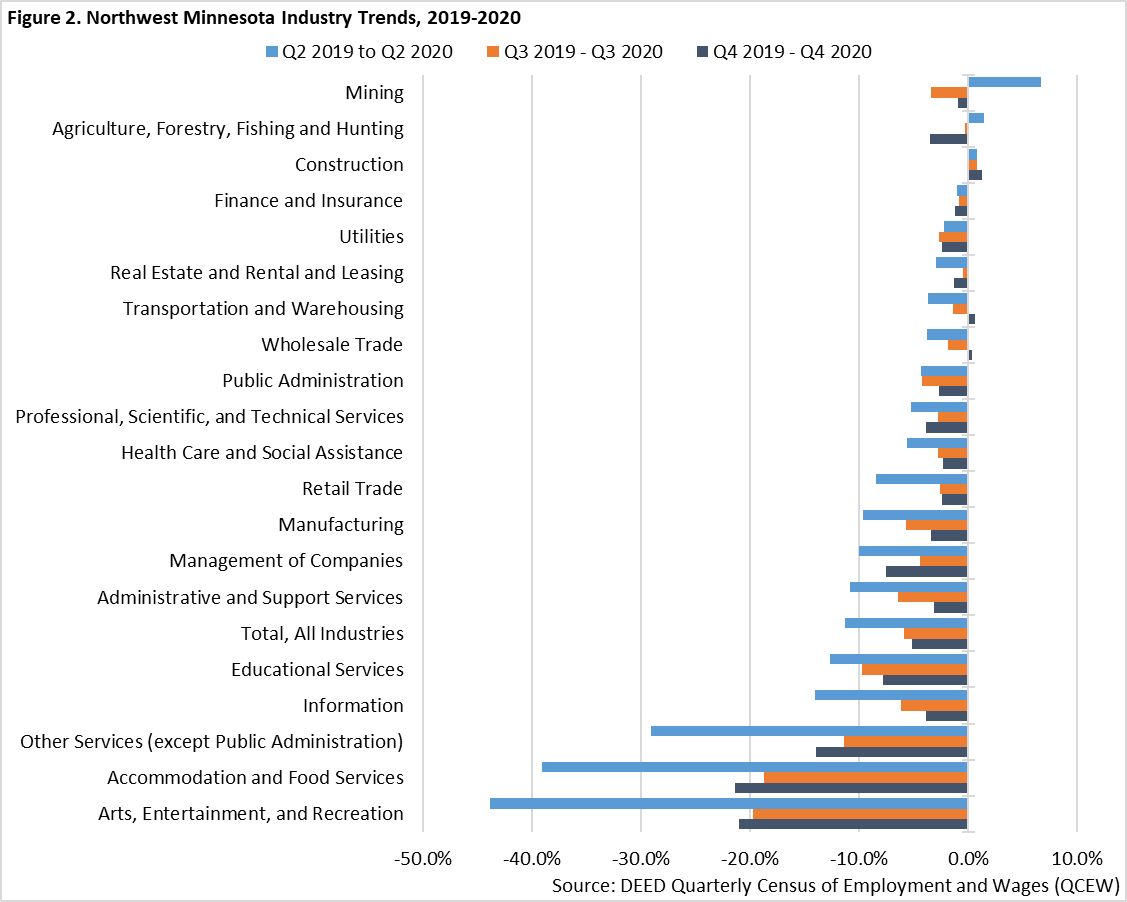
Employment trends for these major industries reveal how Northwest Minnesota's economy and labor market were affected by COVID-19. For example, the Arts, Entertainment & Recreation industry lost the greatest share of employment (-43.8%) at the height of COVID-19's impact during the second quarter of 2020. Accommodation & Food Services (-39.1%) and Other Services (-29.1%) were also severely affected. Information (-14.1%) and Educational Services (-12.7%) rounded out the major industries that lost higher shares of their respective employment than the total of all industries (-11.3%) in the region when comparing the second quarters of 2019 and 2020 (see Figure 2).
Then nearly every major industry sector witnessed improved employment numbers through the third and fourth quarters of 2020. However, Arts, Entertainment & Recreation; Accommodation & Food Services, and Other Services did experience greater over-the-year losses during the fourth quarter, as COVID-19 cases spiked again at the end of 2020. Overall, the region's total over-the-year employment losses decreased from -11.3% in the second quarter to -5.9% in the third quarter to -5.1% in the fourth quarter.
While most major industry sectors witnessed employment losses in Northwest Minnesota during 2020, such losses were generally less severe in the region than they were statewide. For example, where Arts, Entertainment & Recreation employment declined by -22.3% in the region over 2020, it declined by -31.5% statewide. Where Accommodation & Food Services employment declined by -20.2% in the region over 2020, it declined by -24.6% statewide. Only three industries in the region witnessed more significant employment losses during 2020 than the state: Management of Companies; Agriculture, Forestry, Fishing & Hunting; and Educational Services.

When zooming in upon more detailed industries, top-employing sectors for Northwest Minnesota include Educational Services (21,048 jobs); Food Services & Drinking Places (12,849 jobs); Nursing & Residential Care Facilities (11,975 jobs); Hospitals (11,933 jobs); Executive, Legislative & Other General Government Support (11,248 jobs); Ambulatory Health Care Services (8,232 jobs); Merchant Wholesalers, Durable Goods (6,550 jobs); Social Assistance (6,051 jobs); Food Manufacturing (5,969 jobs); and General Merchandise Stores (5,595 jobs). Altogether, these ten in-depth sectors accounted for nearly half (48.1%) of Northwest Minnesota's total employment in 2020.
As described for the major industry sectors, there is no doubt that particular industries were more impacted than others by COVID-19. Table 2 lists the industries losing the most jobs between 2019 and 2020 in Northwest Minnesota. As can be seen, a number of these industries are among the largest in the region, including Food Services & Drinking Places, Educational Services, Nursing & Residential Care Facilities, and Hospitals. Zooming in even further, significant employment losses were witnessed within Restaurants (-2,218 jobs), Traveler Accommodation (-1,647 jobs), Gambling Industries (-1,395 jobs), and Elementary & Secondary Schools (-994 jobs).
Table 2. Northwest Minnesota In-Depth Industries Losing the Most Jobs, Annual 2019-2020 (Sorted by Numeric Change in Jobs)
| Industry | Number of Establishments | Number of Jobs | Avg. Annual Wage | Change in Jobs 2019 – 2020 | |
|---|---|---|---|---|---|
| Numeric | Percent | ||||
| Total, All Industries | 17,362 | 210,740 | $45,136 | -12,454 | -5.6% |
| Food Services & Drinking Places | 1,126 | 12,849 | $16,068 | -2,697 | -17.3% |
| Accommodation | 406 | 4,933 | $24,232 | -1,810 | -26.8% |
| Educational Services | 384 | 21,048 | $47,840 | -1,635 | -7.2% |
| Amusement, Gambling & Recreation Industries | 284 | 2,441 | $21,372 | -654 | -21.1% |
| Religious, Grantmaking, Civic, Professional, & Similar Organizations | 387 | 2,530 | $21,372 | -552 | -17.9% |
| Executive, Legislative, & Other General Government Support | 317 | 11,248 | $48,724 | -521 | -4.4% |
| Transportation Equipment Manufacturing | 31 | 3,848 | $58,136 | -489 | -11.3% |
| Hospitals | 52 | 11,933 | $56,836 | -448 | -3.6% |
| Gasoline Stations | 330 | 3,887 | $22,360 | -270 | -6.5% |
| Administrative & Support Services | 576 | 3,227 | $33,436 | -264 | -7.6% |
| Wood Product Manufacturing | 70 | 3,171 | $55,432 | -236 | -6.9% |
| Fabricated Metal Product Manufacturing | 158 | 3,934 | $51,064 | -230 | -5.5% |
| Social Assistance | 695 | 6,051 | $25,740 | -221 | -3.5% |
| Printing & Related Support Activities | 51 | 1,072 | $38,272 | -190 | -15.1% |
| Motor Vehicle & Parts Dealers | 338 | 3,689 | $45,968 | -177 | -4.6% |
| Machinery Manufacturing | 98 | 3,809 | $64,220 | -175 | -4.4% |
| Personal & Laundry Services | 301 | 1,164 | $23,816 | -166 | -12.5% |
| Ambulatory Health Care Services | 669 | 8,232 | $74,984 | -164 | -2.0% |
| Nursing and Residential Care Facilities | 353 | 11,975 | $32,344 | -161 | -1.3% |
| Merchant Wholesalers, Nondurable Goods | 303 | 4,255 | $61,828 | -147 | -3.3% |
| Source: DEED Quarterly Census of Employment and Wages (QCEW) | |||||
While most industries did lose employment over the course of 2020, there were some industries that gained jobs on an annual basis. Among these industries with the most positive employment growth include Building Material & Garden Equipment & Supplies Dealers (+125 jobs), Couriers & Messengers (+113 jobs), Administration of Economic Programs (+79 jobs), Specialty Trade Contractors (+77 jobs); Construction of Buildings (+62 jobs), Other Information Services (+52 jobs), and Food Manufacturing (+52 jobs).
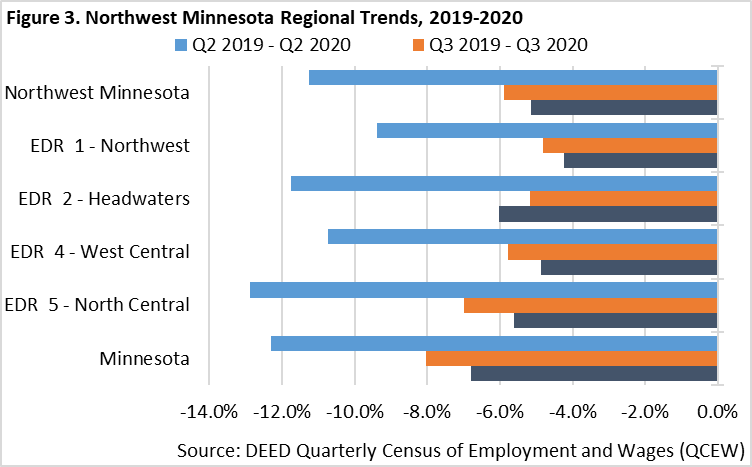
All three Economic Development Regions (EDRs) within Northwest Minnesota witnessed employment losses during 2020. These losses were most severe between the second quarters of 2019 and 2020, ranging from a 12.9% loss for EDR 5, which is more tourism dependent, to a 9.4% loss for EDR 1, which is highly reliant on Manufacturing. Except for EDR 2, all regions within Northwest did witness improved employment trends through the third and fourth quarters of 2020. EDR 2, or the Headwaters region, trended back slightly between the third and fourth quarters of 2020. Despite this slight slip, EDR 2 still had less severe employment losses between the fourth quarters of 2019 and 2020 than Minnesota overall (Figure 2).

With the release of QCEW employment data for the fourth quarter of 2020, we now have the clearest picture yet of how the pandemic-induced recession impacted Northwest Minnesota's economy. As has been covered in past monthly updates, Northwest Minnesota has seen the strongest bounce back from the pandemic recession of the six planning regions in the state.
Looking at annual employment averaged over all four quarters of 2020, employment in the region was 5.6% lower in 2020 compared to 2019. While that was severe, Northwest Minnesota fared better than the state as a whole which finished the year down 6.7%.
By comparing first quarter to second quarter we can capture the initial impacts of the state shutdown in March of last year. In Northwest Minnesota, 13,943 jobs were lost between the first and second quarters, representing a -6.5% decline in employment. That was the smallest relative employment loss in the state, and nearly half the decline experienced in both Northeast and the Twin Cities metro area.
In the recovery that followed from the second quarter to the third quarter, Northwest regained 12,973 jobs, the highest share among planning regions. At that level, that covered 93% of the job losses; whereas the Twin Cities gained back only 33% of jobs lost, and other regions recovered between 40% and 60% of the jobs lost from first to second quarter. Then, even though Northwest was the only region that saw a job loss from the third to the fourth quarter of 2020, it was still closest to its pre-pandemic employment level (see Table 3) in the fourth quarter.
Table 3. Industry Employment Trends by Region, 2020
| Geography | Qtr. 1 2020 Jobs | Qtr. 2 2020 Jobs | Q1-Q2 Job Change | Qtr. 3 2020 Jobs | Q2-Q3 Job Change | Qtr. 4 2020 Jobs | Q3-Q4 Job Change | Q1-Q4 Job Change | Qtr. 4 Percent of Qtr. 1 Jobs |
|---|---|---|---|---|---|---|---|---|---|
| Minnesota | 2,856,226 | 2,560,495 | -295,731 | 2,682,876 | +122,381 | 2,728,214 | +45,338 | -128,012 | 95.5% |
| Central | 272,300 | 250,935 | -21,365 | 263,625 | +12,690 | 265,808 | +2,183 | -6,492 | 97.6% |
| Northeast | 139,914 | 123,430 | -16,484 | 131,778 | +8,348 | 132,114 | +336 | -7,800 | 94.4% |
| Northwest | 215,170 | 201,227 | -13,943 | 214,200 | +12,973 | 212,363 | -1,837 | -2,807 | 98.7% |
| Twin Cities | 1,756,278 | 1,548,924 | -207,354 | 1,617,309 | +68,385 | 1,651,423 | +34,114 | -104,855 | 94.0% |
| Southeast | 243,210 | 221,059 | -22,151 | 232,602 | +11,543 | 235,500 | +2,898 | -7,710 | 96.8% |
| Southwest | 172,007 | 160,383 | -11,624 | 165,834 | +5,451 | 169,533 | +3,699 | -2,474 | 98.6% |
| Source: DEED Quarterly Census of Employment & Wages | |||||||||