
by Dave Senf
March 2018
Seasonal adjustment techniques are applied to employment data to help create a clear picture of jobs in Minnesota.
Last year nonfarm wage and salary employment in Minnesota peaked at an estimated 2,970,000 in June before tailing off to 2,941,500 by December.1 Can it be right that the state lost 28,500 wage and salary jobs from June to December?
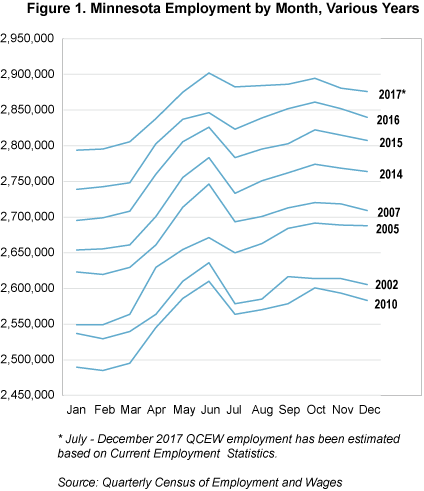
That's what the job estimates show, and it shouldn't surprise anyone because June's employment level has topped December's figures every year since 2005, except for 2016. A quick glance at Figure 1 sheds some light on the annual June-to-December job decline. As the figure shows, Minnesota's monthly employment level undergoes regular fluctuations over the course of a year due to seasonal weather changes, major holidays, annual opening and closing of schools, and even the State Fair.
These more or less regular seasonal shifts, if not accounted for, will produce confusing signals on the direction and strength of almost every economic gauge, including employment, unemployment, GDP (gross domestic product), wage income, initial claims for unemployment insurance, unemployment rate, construction starts and wage income.
That is why most economic measures are seasonally adjusted to smooth out regular seasonal shifts. The statistical technique gives a more informative picture of underlying trends in economic data.
Seasonal adjustment of the economic numbers would be relatively easy if the economy grew at a steady rate without any cyclical ups and downs. In the real world, though, recessions interrupt expansions and cyclical forces get mixed up with seasonal forces. Employment changes in recession years aren't shown in Figure 1, since seasonal swings in employment tend to get overwhelmed by declining employment. It's much easier to visually identify Minnesota's employment seasonality by looking at only normal years as in Figure 1. Normal years are when monthly job growth is fairly stable on a year-over-year basis.
Unadjusted employment in Minnesota has peaked in June in 14 out of the last 16 years. Construction employment has ramped up, school employment doesn't shrink noticeably until summer vacation kicks in fully in July, and summer recreation-related employment hiring has occurred.
October claimed the peak employment month in 2005 and 2016. December, despite the annual hype over Christmas-related retail hiring, usually ranks either fifth or sixth in employment level.
Employment is usually lowest in January, February and March when the construction industry has gone into partial hibernation. Warmer weather recreation, arts and entertainment employment slips (think favorite amusement park, golf course or garden nursery) when the snow begins to fall and is only partly offset by the Bold North winter recreation-related employment uptick (think favorite ski hill or ice fishing-house rental company).
Figure 2 shows how seasonally adjusting employment numbers smooth out seasonal fluctuations by comparing Minnesota's monthly seasonally adjusted total to the unadjusted total since 2001.
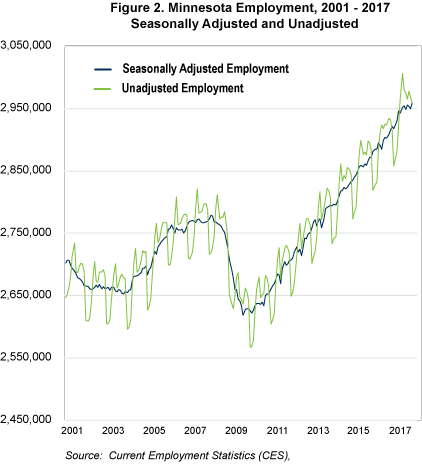
When seasonally adjusted, the employment change between June and December 2016 was an 18,100-job increase, rather than the 28,500-job loss using unadjusted data. The seasonally adjusted takeaway during the second half of 2016 was that job growth slowed compared with the first half of the year, but jobs were still being added. The unadjusted takeaway was that Minnesota employment was declining at a rate usually seen only during recession.
Minnesota and U.S. employment seasonality has been declining over the last six decades as shown in Figure 3. Figure 3 compares the monthly unadjusted employment total to annual average employment for each year.
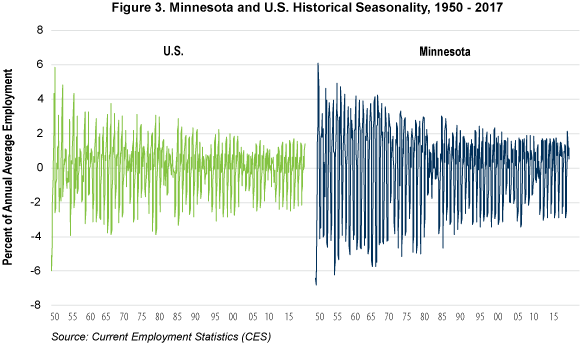
Six decades ago Minnesota's highest employment month exceeded annual average employment by 4 percent or more in most years, while the lowest employment month was 5 or 6 percent below annual average employment. That employment variation has declined through the years, with the highest employment month now 2 percent higher than annual average employment and the lowest employment month roughly 3 percent below annual average employment.
A more sophisticated measure of seasonality is Mean Seasonal Variation (MSV).2 The MSV of Minnesota employment in the 1950s averaged 2.6 compared with the average of 1.1 from 2010 to 2017. The MSV decline implies that employment seasonality was more than double in the 1950s compared with today.
Minnesota's employment seasonality always has been higher than U.S. seasonality, as shown in Figure 3, but the state's employment seasonality has declined faster than nationwide over the last six decades. Minnesota employment seasonality in the 1950s was more than twice as high as nationwide. Today the state's employment seasonality is only 80 percent higher than the U.S. as measured by MSV. The historical change in MSV values for both Minnesota and the U.S. supports the visual impressions from Figure 3.
The fall in seasonal employment over the last 60 years can be traced to seasonal employment declining across almost all industries and to shrinking shares of total employment in industries with high seasonal swings in their workforces. Table 1 lists the 1990 to 2017 average MSV for Minnesota's industries, along with 2017 average annual industry employment. Healthcare and social assistance employment has the lowest seasonality. It's good to know that your health care needs can be met year round. Healthcare and social assistance employment has more than doubled since 1990, boosting the sector's share of Minnesota employment from 9.8 percent in 1990 to 16 percent in 2017.
| Table 1. Seasonality by Sector | |||
|---|---|---|---|
| Sector | 1990 - 2017 Mean Seasonal Value (MSV) | 2017 Annual Average Employment | |
| Construction | 11.1 | 122,157 | |
| Arts, Entertainment, and Recreation | 10.5 | 42,505 | |
| Educational Services | 9.1 | 68,772 | |
| Leisure and Hospitality | 4.5 | 266,126 | |
| Mining and Logging | 4.4 | 6,931 | |
| State Government | 4.4 | 100,579 | |
| Accommodation and Food Services | 3.4 | 223,621 | |
| Administrative/Support and Waste Management | 3.4 | 139,918 | |
| Goods-Producing excluding Agriculture | 3.2 | 448,981 | |
| Local Government | 3.2 | 294,859 | |
| Government | 2.9 | 427,636 | |
| Real Estate and Rental and Leasing | 1.7 | 33,221 | |
| Retail Trade | 1.6 | 303,001 | |
| Non-Durable Goods Mfg. | 1.5 | 118,067 | |
| Total Private | 1.5 | 2,516,138 | |
| Professional and Business Services | 1.4 | 376,519 | |
| Transportation, Warehousing, and Utilities | 1.4 | 102,742 | |
| Trade, Transportation, and Utilities | 1.1 | 538,067 | |
| Total Nonfarm | 1.1 | 2,943,774 | |
| Private Service Providing | 1.1 | 2,067,157 | |
| Manufacturing | 1.0 | 319,893 | |
| Educational and Health Services | 0.9 | 539,826 | |
| Wholesale Trade | 0.9 | 132,324 | |
| Service-Providing | 0.9 | 2,494,793 | |
| Durable Goods Mfg. | 0.8 | 201,826 | |
| Financial Activities | 0.6 | 176,724 | |
| Information | 0.6 | 50,637 | |
| Other Services (Private Only) | 0.6 | 119,258 | |
| Federal Government | 0.5 | 32,199 | |
| Management of Companies and Enterprises | 0.5 | 80,336 | |
| Professional, Scientific, and Technical Services | 0.4 | 156,265 | |
| Finance and Insurance | 0.4 | 143,503 | |
| Health Care and Social Assistance | 0.3 | 471,054 | |
| Source: Current Employment Statistics (CES) | |||
Construction employment – the most seasonal industry – accounted for 3.7 percent of employment in 1990 and 4.1 percent in 2017, while its seasonality has fallen by 20 percent over the last three decades. Educational services, which includes only private education employment, has increased its share of employment from 1.5 to 2.3 percent since 1990. Over the same period, seasonality in educational services employment has declined by 64 percent. Seasonality has declined in 17 out of the 21 industries listed in Table 1. The only industry with a sizable increase in seasonality over the last few decades is arts, entertainment and recreation.
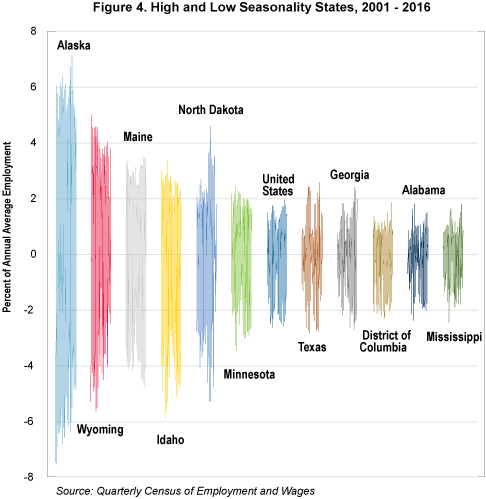
Minnesota's employment seasonality ranks 15th highest among states, right above Nevada and just below Florida. The major role that weather plays in seasonal hiring patterns is highlighted by these three states. Despite having almost polar extremes in weather patterns, they are ranked right next to each other when it comes to seasonal employment swings. If you snowbird to Nevada or Florida in the winter, you contribute to the seasonality in all three states by reducing your spending in Minnesota during the winter while adding to consumer spending in either Nevada or Florida.
The industrial mix of each state also influences employment seasonality. States more dependent on agricultural employment, all else being the same, will have higher seasonality, as agricultural hiring ramps up during harvest time. Southern states tend to have lower employment seasonality than northern states. Figure 4 shows the five states with the most seasonality and the five states with the lowest seasonality. Alaska's hiring pattern over the year has more than four times the seasonality of Mississippi's.
There is higher seasonality in Minnesota employment than measured by the state's MSV. MSV is calculated using total employment which is derived by summing up employment across detailed industries. Some of the detailed industries have differing seasonal hiring and firing patterns that are partially lost when aggregated into total employment. Figure 5 shows this by displaying annual employment swings for two sets of industries – one consisting of eight detailed industries with peak employment during the summer and the other consisting of eight detailed industries with peak employment in the winter.3
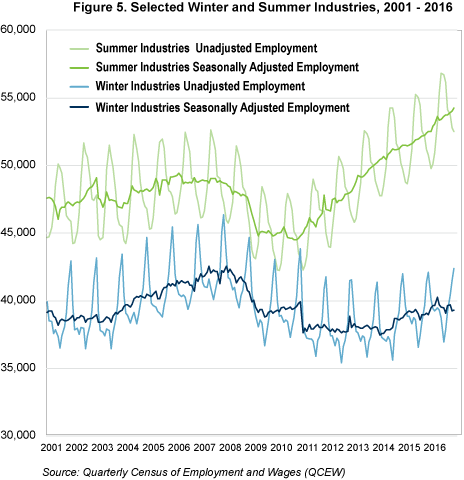
Logging companies, one of the peaking industries in winter, increase their workforce as winter sets in. Meanwhile, firms providing death care services – a summer employment peak industry – reduces its workforce when winter sets in. When summer arrives, death care services employment ramps up while logging companies lay off workers.
The same offsetting scenario exists between child day care services and elementary and secondary schools. Payroll numbers at child day care companies peak in the summer when school is out and then trail off as the school year begins. Elementary and secondary school employment is reduced during the summer and rises when school starts up in the fall.
Employment seasonality varies across Minnesota as shown in Figure 6. Employment in only seven counties was less seasonal than statewide employment between 2001 and 2016. Three of the least-seasonal counties are big in terms of employment: Hennepin, Ramsey and Olmsted. Total employment in the other less-seasonal counties ranges from 20th to 40th largest.
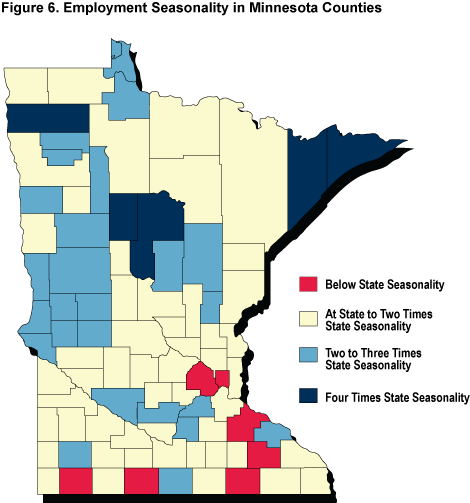
In 51 counties, employment seasonality averaged between just over the statewide level to two times state seasonality. In 29 other counties, employment seasonality was two to four times state seasonality on average between 2001 and 2016. Employment in the remaining five counties experienced more than four times the seasonal swing in employment compared with statewide employment swings.
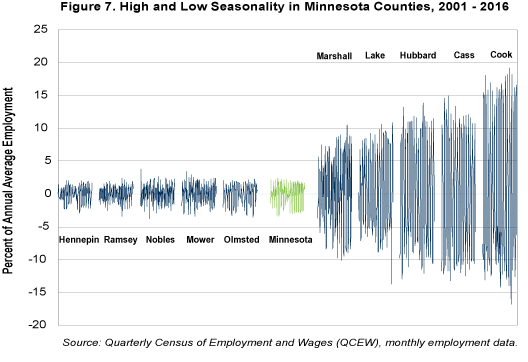
The counties showing the highest level of seasonality were Cass, Cook, Hubbard and Lake. These counties are ground zero for Minnesotans with cabins, so employment surges in the summer, only to fall off steeply when the leaves and tourists disappear in the fall.
Figure 7 shows the annual monthly employment swings in counties with the highest and lowest seasonality from 2001 to 2016. Counties with relatively steady employment through the year, such as Ramsey and Nobles, experience employment swings between 2 percent above to 2 percent below the annual average. Employment in Cook County, on the other hand, swings from 15 percent above annual average to 15 percent below in some years.
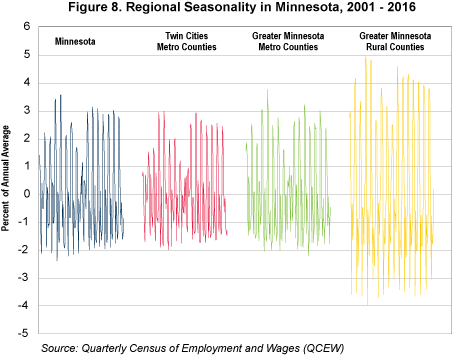
Urban areas with a more diverse mix of industries tend to have lower employment seasonality as displayed in Figure 8. Employment in the 10-county Twin Cities metro area has slightly less employment variation over the year than the combined employment of 11 Greater Minnesota metro counties. Combined employment in the 66 other counties – all rural counties in Greater Minnesota – is more seasonal than in the urban counterparts. Higher unemployment rates in some rural parts of Minnesota can be partly explained by a higher percentage of jobs being seasonal in nature. Year-round employment not only contributes to lower unemployment rates but also more stable income.
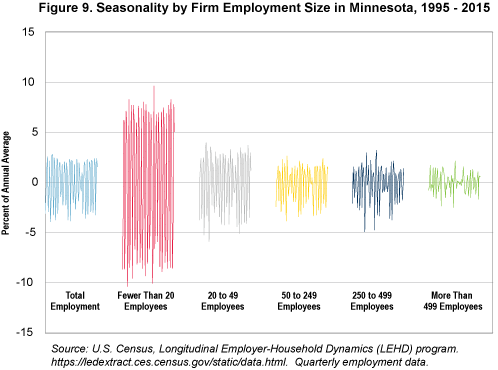
Pay at larger firms tends to be higher than at smaller firms. Part of the reason can be tracked to the higher proportion of seasonal jobs at smaller firms. Jobs at companies with fewer than 20 workers are roughly three times more seasonal than jobs at companies employing 500 or more as shown in Figure 9. Two highly seasonal industries – construction and agriculture – are disproportionally made up of small-sized companies, which helps explain the variation of employment seasonality shown in the figure.
While the share of jobs in Minnesota that are seasonal has decreased over the years, recognizing the month-to-month employment swings that regularly occur during a year in Minnesota is a must for accurately gauging Minnesota's job growth path. Employment seasonality varies across the state and industries, which actually works to hide some of the hiring and separating activity related to regular seasonal employment swings. Seasonal adjustment techniques are applied to employment data to smooth out the seasonality, helping to create a clear picture of jobs in Minnesota.
Why Seasonal Adjusting is Valuableby Steve Hine Dave Senf's story illustrates some of the many industries where employment tends to fluctuate in somewhat typical and recurring patterns during the year. These seasonal patterns stem from calendar effects beyond just changing weather, even here in Minnesota. And the patterns shown in one industry may be quite different – in terms of timing, frequency and magnitude – from those of another. Consider construction, retail trade and education as examples. Even within an industry sector we may see components with very different seasonal tendencies – garden supply stores and department stores within retail, or ski areas and golf courses within arts and recreation for example. Add to these complex seasonal variations the additional complications that come with the timing of events from year to year. The number of shopping days between Thanksgiving and Christmas, for example, or the timing of the start or end of the school year may cause dramatic shifts in the timing of hiring and downsizing in these areas. And overlaid with all these disparate changes is the fact that our economy is ever-evolving. The impact that highly seasonal sectors like farming and construction have on our overall economy is diminishing, while less volatile areas like health care and business services are growing in importance. Despite the complex nature of seasonal fluctuations in most economic time series, including employment, a clear divining of the condition of our labor markets requires some method of distinguishing what part of a change is typical "for this time of year" and how much might be atypical and therefore indicative of real change. The widely used method for accomplishing this and adjusting employment data goes by the somewhat unfortunate acronym X-13 ARIMA SEATS. This involves identifying, through application of any number of statistical packages, a purely mathematical relationship between a variable and its past values at various lags, and using these intertemporal relationships between current and past values to estimate and remove changes across time that are common and persistent. The result is then a series that reflects only the "uncommon" changes over time, those that are greater or less than what has been typical over the course of the historical data series used in the exercise. It's important to note, if only because this is often asked by those unfamiliar with the process, that seasonally adjusting a time series is a mathematical exercise. It does not involve analysts using their judgment to determine whether some seasonal event like a blizzard has affected the numbers. The past behavior of the data identifies what's "typical" for a given indicator at a particular time of year. The remaining change is then identified as the "seasonally adjusted" change, or that part of the change that is irregular and perhaps indicative of changes in conditions that are out of the ordinary. These are what trackers of our economy are looking for, and why seasonally adjusting data is so valuable to that effort. |
1Seasonally unadjusted employment estimate from Current Employment Statistics (CES).
2Mean Seasonality Variation for employment for a year is the mean of each month's absolute value of the difference between seasonally adjusted and unadjusted employment divided by the seasonally adjusted employment. See "Labour Market Seasonality in Canada: Trends and Policy Implications,", for further details.
3Industries with peak summertime employment: amusement parks and arcades, beer and wine wholesale merchants, building material and supplies dealers, child day care services, death care services, museums, historical sites, other motor vehicle dealers, and remediation and other waste management services.
Industries with peak wintertime employment: book, periodical, and music stores, clothing stores, cut and sew apparel manufacturing, private elementary and secondary schools, footwear manufacturing, home furnishings stores, jewelry, luggage and leather goods stores, and logging.