by Mark Schultz
June 2020
The coronavirus pandemic that spread across the nation and state in March and April of 2020 put a halt to the longest running economic expansion in recent history. Statewide, more than 660,000 workers had filed applications for Unemployment Insurance (UI) in Minnesota from March 16 to May 16, with specific demographics, geographies and industries more affected than others. To put the recent economic events into context, DEED has provided a set of articles explaining the impact in each region.
Southeast Minnesota received a shock to the system in mid-March as the COVID-19 pandemic spread through the state. The region suffered historically high numbers of Unemployment Insurance (UI) applications, and the age, gender, educational attainment and occupation demographics of those impacted by COVID-19 job losses and hour reductions are different than in past years or during the Great Recession.
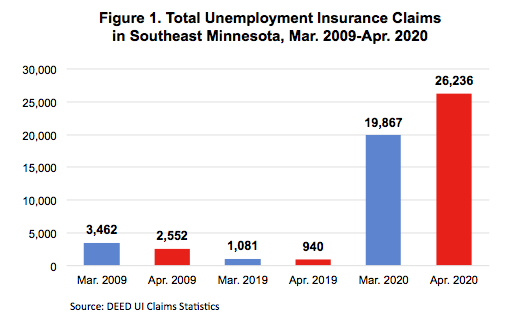
Between March 16 and May 16, over 53,500 workers had filed applications for UI in the 11-county Southeast Minnesota planning region. The region has never seen numbers like this before. It is difficult to put these numbers in perspective in comparison to past years. There were about 2,000 initial UI claims filed in March and April of 2019. Even at the height of the Great Recession in 2009, just over 6,000 people filed claims in March and April (see Figure 1).

Despite the unprecedented numbers of initial claims, Southeast Minnesota has fared better than three of the six state planning regions and better than the state as a whole. Through May 16, UI applications had affected 18.9% of the total labor force in Southeast Minnesota, compared to about 21.6% of the state's labor force. This is likely due to the region's lower concentration of employment in hard-hit industries like leisure and hospitality and retail trade; and the region's higher concentration of employment in sectors like health care and manufacturing, large portions of which were deemed critical and remained in operation during the Stay at Home order.
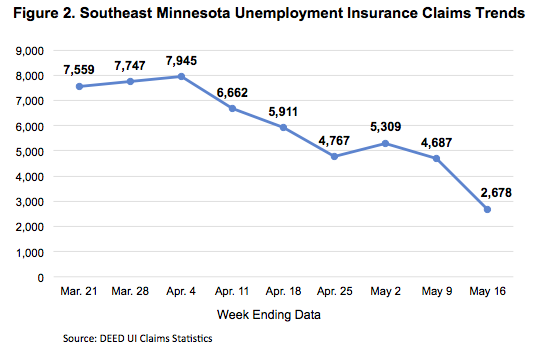
The largest number of applications in the region occurred during the week ending on April 4 with 7,945 applications (see Figure 2). The following three weeks the number of applications steadily declined, falling to 4,767 in the week ending on April 25, a drop of 40%. After this, there was an unexpected increase in applications the following week ending May 2, before seeing subsequent declines the following two weeks. The region stands out for the slower decline in applications in recent weeks, due to continuing layoffs in health care and social assistance, which is more concentrated in Southeast than any other region.

When looking at cumulative UI applications as a share of the most current labor force estimates, Olmsted County is the front-runner in the region with just over 19,950 applications, which is 22.7% of the county's labor force. Other counties that saw large numbers of UI applications include Rice (6,088), Goodhue (5,300), and Winona (4,937). Of the 11 counties in the Southeast region, 10 saw the share of UI applicants exceed 15% of the total 2019 labor force, including 19.8% in Goodhue and 19.3% in Dodge (see Table 1).
Table 1. Southeast Minnesota Cumulative UI Applications Since March 16 by County and Share of 2019 Annual Labor Force
| County | UI Applications 3/16-5/17 | Share of March 2020 Labor Force |
|---|---|---|
| Dodge Co. | 2,260 | 19.3% |
| Fillmore Co. | 1,805 | 16.0% |
| Freeborn Co. | 2,808 | 17.6% |
| Goodhue Co. | 5,300 | 19.8% |
| Houston Co. | 1,039 | 10.1% |
| Mower Co. | 3,111 | 15.5% |
| Olmsted Co. | 19,951 | 22.7% |
| Rice Co. | 6,088 | 16.4% |
| Steele Co. | 3,953 | 18.6% |
| Wabasha Co. | 2,269 | 18.9% |
| Winona Co. | 4,937 | 17.3% |
| Source: DEED Unemployment Insurance Statistics | ||
While white workers made up 91.3% of the labor force in the region, they accounted for just 82.3% of UI applications through May 16. This means that layoff activity has been more concentrated among People of Color within the region, and for two groups in particular. Just over one-third of Black or African American workers have applied for unemployment – nearly double the rate for white workers – and almost 28% of American Indian workers were affected. Likewise, more than one in every five Asian or Pacific Islanders submitted a UI application through May 16 (see Table 2). These adverse employment impacts on People of Color can deepen the economic disparities already present in the region.
Table 2. Southeast Minnesota Unemployment Insurance Applicants by Race, Mar. 16-May 16
| Race | Cumulative UI Applications Through May 16 | Share of UI Applications | Total Labor Force | Share of Total Labor Force | UI Applications as a Share of Total Labor Force |
|---|---|---|---|---|---|
| White Alone | 43,836 | 82.3% | 250,983 | 91.3% | 17.5% |
| Black or African American | 2,638 | 5.0% | 7,661 | 2.8% | 34.4% |
| American Indian/Alaska Native | 209 | 0.4% | 751 | 0.3% | 27.8% |
| Asian or Pacific Islanders | 1,812 | 3.4% | 8,333 | 3.0% | 21.7% |
| Some Other Race and Two or More Races | 844 | 1.6% | 7,302 | 2.7% | 11.6% |
| Choose not to answer | 1,589 | 3.0% | N/A | N/A | N/A |
| Hispanic or Latino | 2,359 | 4.4% | 13,342 | 4.9% | 17.7% |
| Total | 53,271 | 100.0% | 275,030 | 100.0% | 19.4% |
| Source: DEED Unemployment Insurance Statistics, 2014-2018 American Community Survey 5-Year Estimates | |||||
The flood of layoffs has also affected a different gender, age, educational attainment and occupation demographic than in recent years and the Great Recession. In March and April of 2009 and 2019, about two-thirds of UI claims in the region were filed by males; whereas in March and April of 2020, about 56% were filed by females. This is because of the prevalence of females working in the industries most impacted by COVID-19, including accommodation and food services, personal care, and health care and social assistance. For example, according to DEED's Quarterly Employment Demographics data, a larger portion of jobs in accommodation and food services were held by females in the second quarter of 2019 (58%) and almost three-quarters (74.8%) of the jobs in personal and laundry services were held by females and both of these industries saw larger numbers of layoffs and subsequent UI claims than most other industries.
The age profile of claimants during COVID-19 is younger than in past years. For example, just 20.8% of UI claims were filed by people under age 30 in March and April 2019; compared to 27.2% in 2009. However, in March and April of 2020, 28.5% of claims were filed by those under 30. Again, this is due to industries that were hit hardest by layoffs relying on younger workers. For example, 43.8% of the jobs in 2019 in accommodation and food services were held by those under the age of 25.

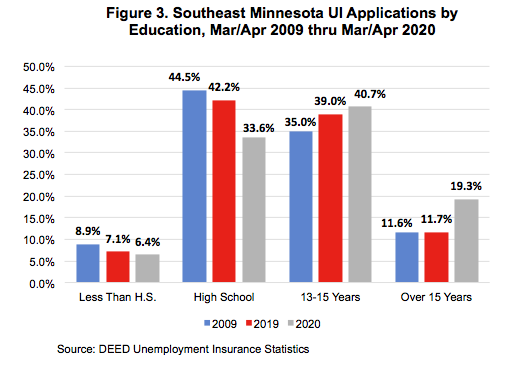
In contrast to past years, the COVID-19 pandemic has also prompted a higher number of individuals with a bachelor's degree or higher (over 15 years of education) to apply for unemployment benefits than in past years. In March and April during both the Great Recession and last year, between 49.3% (2019) and 53.5% (2009) of claims were filed by workers with a high school diploma or less. In March and April of 2020 however, just 40% of claims have been filed by the least educated workers, while 60% of claims have been filed by people with college experience, including almost 20% with a bachelor's degree or higher (compared to 11.7% in 2019 and 11.6% in 2009). This hike in claims among the higher educated may partially be the result of layoffs in health care, which includes health diagnosing and treating practitioners which often require higher education.
A different set of occupations have been impacted this time in comparison to past years as well. Construction and production occupations accounted for a much larger percentage of UI claims in March and April of 2009 (48.7%) and 2019 (44.1%) compared to 2020 (17.3%). Instead, food preparation and serving related saw the highest percentage of claims during March and April of 2020 at 18.4%, which is more than double what was seen in both 2009 and 2019. Other occupational groups that saw much higher percentages of claims in 2020 are sales and related, healthcare practitioners and technical, and personal care and service workers. And while construction and production saw a much smaller percentage of UI applications in March and April of this year compared to past years, the number of applications in these two occupational groups was still notable (see Table 3).
Table 3. Unemployment Claims by Occupational Group (March/April 2009-March/April 2020)
| Occupational Group | Mar./Apr. 2009 | Mar./Apr. 2019 | Mar./Apr. 2020 | |||
|---|---|---|---|---|---|---|
| Total | Percent | Total | Percent | Total | Percent | |
| Food Preparation & Serving | 387 | 7.1% | 158 | 8.5% | 7,617 | 18.4% |
| Sales & Related | 361 | 6.6% | 110 | 5.9% | 4,065 | 9.8% |
| Production | 1,526 | 28.1% | 223 | 12.0% | 3,933 | 9.5% |
| Office & Administrative Support | 348 | 6.4% | 153 | 8.2% | 3,540 | 8.6% |
| Healthcare Practitioners & Technical | 100 | 1.8% | 45 | 2.4% | 3,406 | 8.2% |
| Construction & Extraction | 1,117 | 20.6% | 598 | 32.1% | 3,235 | 7.8% |
| Healthcare Support | 165 | 3.0% | 75 | 4.0% | 2,463 | 6.0% |
| Personal Care & Service | 51 | 0.9% | 23 | 1.2% | 2,324 | 5.6% |
| Transportation & Material Moving | 283 | 5.2% | 121 | 6.5% | 1,829 | 4.4% |
| Management | 188 | 3.5% | 72 | 3.9% | 1,712 | 4.1% |
| Installation, Maintenance and Repair | 252 | 4.6% | 54 | 2.9% | 1,440 | 3.5% |
| Education, Training & Library | 51 | 0.9% | 19 | 1.0% | 1,232 | 3.0% |
| Building & Grounds Cleaning & Maintenance | 76 | 1.4% | 49 | 2.6% | 1,222 | 3.0% |
| Arts, Design, Entertainment, Sports & Media | 39 | 0.7% | 17 | 0.9% | 861 | 2.1% |
| Business & Financial Operations | 97 | 1.8% | 34 | 1.8% | 685 | 1.7% |
| Computer & Mathematical | 118 | 2.2% | 40 | 2.1% | 582 | 1.4% |
| Community & Social Services | 20 | 0.4% | 10 | 0.5% | 390 | 0.9% |
| Architecture & Engineering | 156 | 2.9% | 16 | 0.9% | 353 | 0.9% |
| Farming, Fishing & Forestry | 64 | 1.2% | 31 | 1.7% | 214 | 0.5% |
| Protective Service | 13 | 0.2% | 7 | 0.4% | 137 | 0.3% |
| Life, Physical & Social Science | 6 | 0.1% | 3 | 0.2% | 67 | 0.2% |
| Legal | 15 | 0.3% | 6 | 0.3% | 61 | 0.1% |
| Source: DEED Unemployment Insurance Statistics | ||||||
The COVID-19 pandemic has caused dramatic labor market changes in Southeast Minnesota, including layoffs and massive increases in the number of UI claims – claims that reveal that different demographic and occupational groups are hardest hit compared to last year and during the Great Recession.