
by Cameron Macht
September 2016
The increasing number of older workers is one of the most significant changes in the Minnesota labor force.
As David Bowie once warned in "Changes," pretty soon we're all going to get a little older. As the workforce ages, many employers are already straining to find new workers. The increasing number of older workers is one of the most significant changes occurring in Minnesota's economy, affecting every industry in every region of the state.
Twenty percent of jobs in Minnesota are now held by workers ages 55 and over, up from 13.5 percent of jobs just one decade earlier. And the next decade will likely bring even more change, with another 20 percent of jobs currently held by 45 to 54 year olds (see Table 1).
| Minnesota Employment Demographics by Age Group, 2005-2015 | |||
|---|---|---|---|
| - | Percent of Jobs in 2005 | Percent of Jobs in 2015 | Change in Jobs, 2005-2015 |
| TOTAL JOBS | 100.0% | 100.0% | +5.5% |
| 19 years and younger | 8.6% | 6.9% | -15.6% |
| 20 to 24 years | 12.5% | 11.2% | -5.3% |
| 25 to 44 years | 43.8% | 42.1% | +1.6% |
| 45 to 54 years | 21.6% | 20.2% | -1.0% |
| 55 to 64 years | 10.8% | 15.5% | +51.7% |
| 65 years and older | 2.7% | 4.0% | +54.5% |
| Source: DEED, Quarterly Employment Demographics (QED) | |||
In contrast, the number of jobs held by workers in the youngest age groups was falling fast. Teenagers dropped out of the labor force in large numbers over the past decade, and for a variety of reasons.
A large number of teenagers and young adults are focusing more on their educations, while others are busier with activities than in the past. Many struggled to compete with more experienced workers for the limited job openings during the recession.
However, with the labor market tightening in recent years and older workers starting to retire, teenagers are re-entering the workforce in greater numbers and snatching up entry-level jobs in industries like accommodation and food services, retail trade, health care and social assistance, and arts, entertainment and recreation.
DEED's new Quarterly Employment Demographics (QED) program makes it easier to document the dynamics behind the aging of Minnesota's workforce. Collected through a data exchange between DEED and the Minnesota Department of Public Safety, the QED data combine wage records from Minnesota's Unemployment Insurance Program with demographic data on gender and date of birth from driver's license records.
Though drawn from the same wage records as DEED's Quarterly Census of Employment and Wages (QCEW) program, directly comparing the two datasets is problematic. Whereas QCEW is an average of the employment count during each month, wage records in QED are not limited to the reference week and treat individual Social Security numbers separately, causing QED to produce higher employment counts than QCEW. Therefore, QED may be easier to understand as a share of total employment rather than a count of jobs.
In addition, employment data only can be linked for workers who have driver's licenses, though the QED dataset has consistently shown a better than 90 percent match rate with wage records. By assigning demographic data to wage records, the QED dataset provides new insights that weren't previously available, including median hourly wages by gender and age group, broken down at the state, regional and county level.
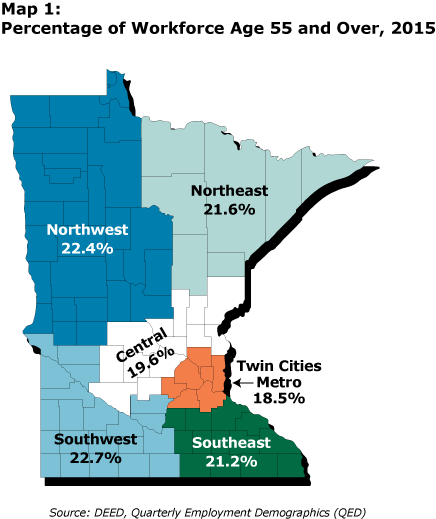
From a workforce standpoint, the two oldest regions in the state were Southwest and Northwest, which both had over 22 percent of jobs held by workers ages 55 and over. On the other side of the state, over 21 percent of the workforce in both Northeast and Southeast were in the oldest age groups.
The Twin Cities, home to 60 percent of the jobs in the state, was the youngest region, with just 18.5 percent of job holders in the oldest age groups. Likewise, less than 20 percent of jobholders in Central Minnesota were 55 and older in 2015 (see Map 1).
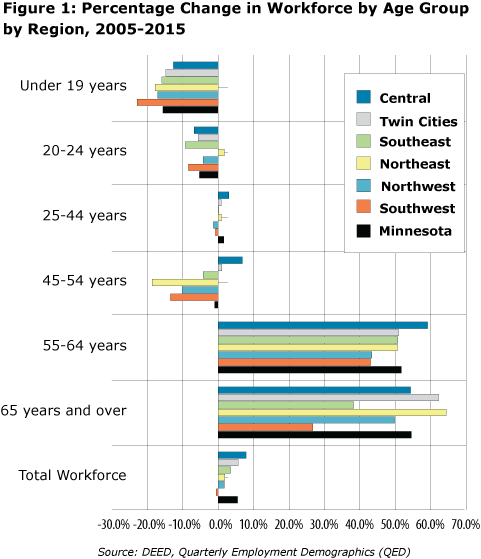
Every region saw huge increases in the number of older workers over the past decade, a shift made more significant by huge declines in the number of jobs held by younger workers (see Figure 1).
Teenagers and entry-level workers suffered the brunt of the job cutbacks in Southwest Minnesota over the past decade, but the region still had the third-highest percentage of jobs held by younger workers in 2015.
As noted, the 23-county planning region has the strongest dependence on older workers in the state, but ironically saw the slowest increase in the number of jobs held by the oldest workers between 2005 and 2015 (see Table 2).
| Southwest Minnesota | |||
|---|---|---|---|
| Employment Demographics | Percent of Jobs in 2005 | Percent of Jobs in 2015 | Change in Jobs, 2005-2015 |
| 19 years and younger | 11.1% | 8.6% | -22.9% |
| 20 to 24 years | 13.0% | 12.0% | -8.4% |
| 25 to 44 years | 38.1% | 38.0% | -0.8% |
| 45 to 54 years | 21.6% | 18.8% | -13.5% |
| 55 to 64 years | 11.9% | 17.2% | +43.0% |
| 65 years and older | 4.3% | 5.5% | +26.7% |
| Source: DEED, Quarterly Employment Demographics (QED) | |||
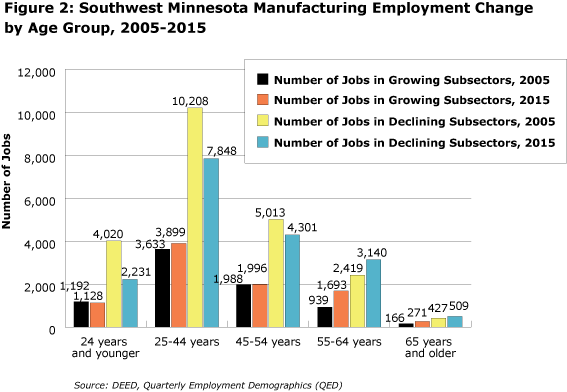
Southwest Minnesota is unique as the only region where manufacturing is still the largest employing industry, with just under 32,000 jobs. From 2005 to 2015, the region's manufacturers cut 3,600 jobs, a 10 percent decline. Six of the 14 manufacturing subsectors in Southwest Minnesota, however, added jobs over the past decade, while the other eight lost jobs.
The growing subsectors – which included nonmetallic mineral product, fabricated metal product, chemical, machinery and miscellaneous manufacturing – tended to be smaller, accounting for less than one-third of total manufacturing employment. The declining subsectors were much larger, including food manufacturing, printing, and computer and electronic product manufacturing. It is important to note that the latter two subsectors accounted for 80 percent of the region's job losses from 2005 to 2015.
The growing subsectors gained both younger and older workers over the past decade, while the declining subsectors cut younger workers and added older workers – or more likely just held onto workers who moved into the older age groups through the natural aging process. Just 2.9 percent of jobs in manufacturing in the region are held by workers ages 65 and over, which will lead to more changes in the next decade (see Figure 2).
Northwest Minnesota also relied on a relatively old workforce, with more than 22 percent of the workforce ages 55 and over, and 5.4 percent past the traditional age of retirement. Like Southwest, Northwest's workforce has been trending older for much longer, actually seeing a slower increase in the number of older workers than the rest of the state (see Table 3).
| Northwest Minnesota | |||
|---|---|---|---|
| Employment Demographics | Percent of Jobs in 2005 | Percent of Jobs in 2015 | Change in Jobs, 2005-2015 |
| 19 years and younger | 11.7% | 9.5% | -17.1% |
| 20 to 24 years | 12.3% | 11.5% | -4.3% |
| 25 to 44 years | 38.4% | 37.2% | -1.4% |
| 45 to 54 years | 21.9% | 19.3% | -10.2% |
| 55 to 64 years | 12.0% | 17.0% | +43.4% |
| 65 years and older | 3.7% | 5.4% | +49.8% |
| Source: DEED, Quarterly Employment Demographics (QED) | |||
Still, every industry in Northwest Minnesota saw an increase in the number of jobs held by workers ages 55 and older over the past decade. Just six industries added younger workers from 2005 to 2015, with the biggest gains occurring in educational services, health care and social assistance, and administrative support and waste management services, which includes temporary staffing services.
In contrast, young workers in the region were swiftly and substantially displaced from the accommodation and food services and retail trade industries, which traditionally employ the youngest workers.
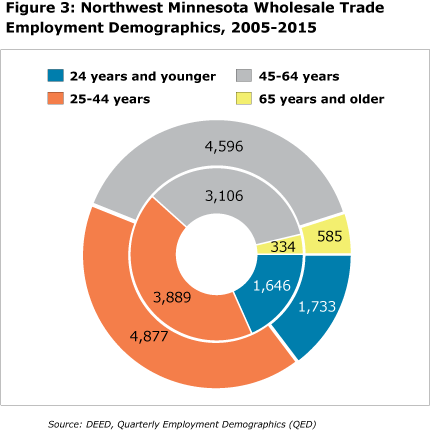
Interestingly, the region's distinguishing wholesale trade industry saw rapid employment growth over the past decade, adding over 2,800 jobs, a 30 percent increase. The job gains were spread across every age group, with even young workers seeing an increase in hiring. In fact, nearly 40 percent of the new jobs were gained by workers who were younger than 45 (see Figure 3).
Surprisingly, Northeast Minnesota has the second-smallest percentage of workers in both the youngest and oldest age groups, behind only the Twin Cities. The dearth of employment at both ends of the age spectrum was not due to a lack of opportunities. It was primarily because of the region's low labor force participation rates, especially for older workers. While low, they were rising over time, as Northeast Minnesota saw the fastest regional increase in the number of jobs held by workers ages 65 and over (see Table 4).
| Northeast Minnesota | |||
|---|---|---|---|
| Employment Demographics | Percent of Jobs in 2005 | Percent of Jobs in 2015 | Change in Jobs, 2005-2015 |
| 19 years and younger | 9.5% | 7.6% | -17.8% |
| 20 to 24 years | 12.8% | 12.7% | +1.7% |
| 25 to 44 years | 38.8% | 38.4% | +0.9% |
| 45 to 54 years | 24.6% | 19.6% | -18.7% |
| 55 to 64 years | 11.8% | 17.5% | +50.6% |
| 65 years and older | 2.5% | 4.0% | +64.3% |
| Source: DEED, Quarterly Employment Demographics (QED) | |||
Despite increasing their employment over the past decade, people 65 and older still held less than 2 percent of the jobs in one-third of the industries in the region – including mining, utilities, construction, manufacturing, management of companies, and accommodation and food services. Instead, older workers were most likely to be found working in health care and social assistance, retail trade, educational services and public administration.
In contrast, just three industries in Northeast Minnesota saw an increase in jobs held by teenagers: utilities, health care and social assistance, and educational services, where the number of teen workers nearly tripled from 2005 to 2015. More than two-thirds of the region's teenagers work in just four industries: accommodation and food services, health care and social assistance, retail trade and educational services.
Aided by the region's status as a medical destination, Southeast Minnesota has enjoyed healthy employment growth over the past decade. Every industry experienced a shift toward an older workforce, but they were all overshadowed by the outsized influence of the region's health care and social assistance sector, which accounted for more than one-third of the jobs gained by workers ages 55 and over.
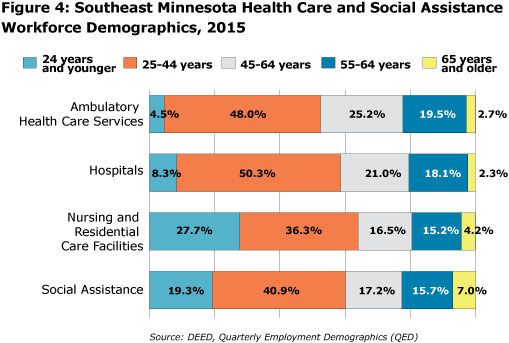
The four subsectors in health care and social assistance are a study in contrasts, clearly influenced by the educational and physical requirements of the jobs in each specialty. Led by health care practitioners like doctors and nurses, ambulatory health care services and hospitals both rely much more heavily on middle-aged workers – with nearly 50 percent of jobs held by 25 to 44 year olds. But they also have shown a growing reliance on older workers, with more than 40 percent of jobs held by workers between the ages of 45 and 64.
On the other hand, nursing and residential care facilities and social assistance employers depend on a steady flow of younger workers, with nearly a quarter of the total workforce under 25 years of age. Youngsters often take these jobs while pursuing further postsecondary education, and then move on to hospitals and clinics. This is shown by the smaller percentages of workers from ages 25 to 44. To fill open jobs, these subsectors have increased hiring in the oldest age groups in recent years (see Figure 4).
| Southeast | |||
|---|---|---|---|
| Employment Demographics | Percent of Jobs in 2005 | Percent of Jobs in 2015 | Change in Jobs, 2005-2015 |
| 19 years and younger | 9.8% | 7.9% | -15.9% |
| 20 to 24 years | 12.3% | 10.8% | -9.3% |
| 25 to 44 years | 41.1% | 39.8% | +0.1% |
| 45 to 54 years | 21.9% | 20.2% | -4.3% |
| 55 to 64 years | 11.4% | 16.7% | +50.7% |
| 65 years and older | 3.4% | 4.6% | +38.2% |
| Source: DEED, Quarterly Employment Demographics QED) | |||
This region boasts the youngest and fastest-growing workforce in the state. The dynamics behind the demographic shifts in this region are unique. Central Minnesota is the only region where more jobs are still held by workers under the age of 25 than by workers 55 and older.
Central Minnesota, however, also experienced the fastest increase of any region in the number of jobs held by workers over 55 from 2005 to 2015, jumping from 13.3 percent to 19.6 percent (see Table 6).
| Central Minnesota | |||
|---|---|---|---|
| Employment Demographics | Percent of Jobs in 2005 | Percent of Jobs in 2015 | Change in Jobs, 2005-2015 |
| 19 years and younger | 11.7% | 9.5% | -12.7% |
| 20 to 24 years | 13.9% | 12.0% | -6.8% |
| 25 to 44 years | 40.9% | 39.1% | +3.0% |
| 45 to 54 years | 20.1% | 19.9% | +6.8% |
| 55 to 64 years | 10.3% | 15.2% | +59.1% |
| 65 years and older | 3.0% | 4.4% | +54.3% |
| Source: DEED, Quarterly Employment Demographics (QED) | |||
The region's construction industry suffered severe jobs cuts during the recession, losing just over one-quarter of total employment between 2005 and 2010. Since then, Central Minnesota has seen a strong recovery and was nearly back to 2005 levels in 2015. But while the jobs have returned, the age of the workers holding them has changed.
Workers under 25 years of age held 27.7 percent of total jobs in 2005, but they now hold just 19 percent. This shift was even more significant in the construction of buildings and specialty trade contractors subsectors, which both dropped from more than 30 percent to 20 percent (see Figure 5). It was much less earth shattering in the heavy and civil engineering construction subsector, where only about 15 percent of workers were in the youngest age groups in either time period.
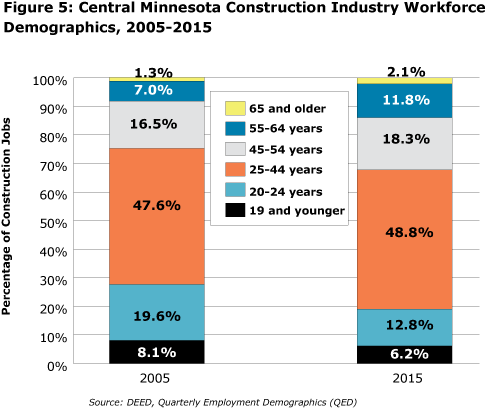
Interestingly, the percentage of construction workers between 25 and 44 years of age held mostly steady, rising just 1.2 percent from 2005 to 2015. Instead, the share of workers over the age of 45 jumped from 24.7 percent to 32.2 percent, rising from one in every four workers to one in every three. More than 40 percent of workers in heavy and civil engineering construction were 45 years and older.
Already home to well over half of the state's population and labor force, the seven-county Twin Cities metro area also draws in nearly 250,000 workers from surrounding regions. Sixty percent of the state's jobs are located in the Twin Cities, making it a prime location for people to grow their careers.
Speaking of prime, nearly two-thirds (64.6 percent) of the region's total jobs were held by workers from ages 25 to 54, often considered the prime working years. That is easily the largest share in the state, nearly 5 percent above the next closest region and 8 percent above the lowest region (see Table 7).
| Twin Cities Metro Area | |||
|---|---|---|---|
| Employment Demographics | Percent of Jobs in 2005 | Percent of Jobs in 2015 | Change in Jobs, 2005-2015 |
| 19 years and younger | 7.3% | 5.9% | -14.8% |
| 20 to 24 years | 12.3% | 11.0% | -5.7% |
| 25 to 44 years | 46.2% | 44.1% | +0.8% |
| 45 to 54 years | 21.4% | 20.5% | +1.0% |
| 55 to 64 years | 10.4% | 14.9% | +50.9% |
| 65 years and older | 2.3% | 3.5% | +62.2% |
| Source: DEED, Quarterly Employment Demographics (QED) | |||
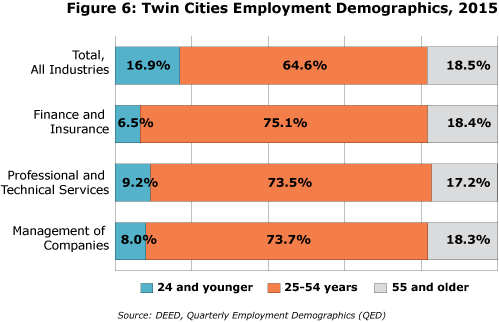
This is especially notable in three industries that are much more strongly concentrated in the Twin Cities than anywhere else: finance and insurance, professional and scientific services, and management of companies. Nearly three-fourths of workers in these three industries were between the ages of 25 and 54 in 2015, although that was a slight decline since 2005.
Due to higher educational requirements for many of the careers in these industries, it is harder for younger workers to get established, while the number of older workers is in line with the total of all industries (see Figure 6).
As the demographic profile of Minnesota's workforce continues to change, employers in every industry and region will be affected. Some sectors have embraced the changes, while others have been slow to adapt. DEED's QED program allows better analysis of the dynamics behind the changes.