by Sanjukta Chaudhuri
December 2019
In 2018, Minnesotans living with disabilities continued to face significant barriers to realizing their full economic potential.
DEED's mission is to empower the growth of the Minnesota economy for everyone by reducing employment disparities and promoting an equitable work environment. For the Labor Market Information Office, this means paying close attention to the specific labor market challenges faced by populations with barriers to employment. This article focuses on Minnesotans with a disability, comparing and contrasting their labor market statistics with the general population and Minnesotans with no disability.
As of 2018, more than 600,000 Minnesota residents reported having at least one disability, comprising 11 percent of the state's population (Table 1). This was up from 580,494 in 2014 (10.8 percent of the total population). A little over half of Minnesotans with a disability are male; the share of females increased marginally, from 49 percent in 2014 to 49.2 percent in 2018.
| Table 1. Percentage of Minnesotans with Disabilities and Percent Female | ||||
|---|---|---|---|---|
| Year | Total Population | With a Disability | Percent with a Disability | Percent Female Among Those With a Disability |
| 2018 | 5,553,564 | 608,744 | 11.0% | 49.2% |
| 2017 | 5,519,199 | 615,846 | 11.2% | 48.2% |
| 2016 | 5,462,438 | 602,014 | 11.0% | 49.8% |
| 2015 | 5,431,894 | 593,675 | 10.9% | 49.2% |
| 2014 | 5,398,211 | 580,494 | 10.8% | 49.0% |
| Source: American Community Survey, one year estimates 2014 through 2018 | ||||
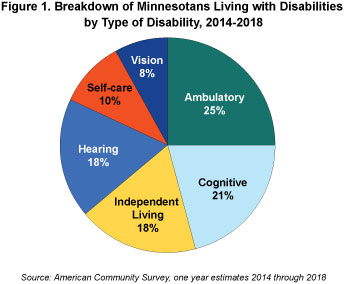
As Figure 1 shows, the most common disability reported was ambulatory (25 percent), followed by cognitive (21 percent), independent living (18 percent), hearing (18 percent), self-care (10 percent), and vision (8 percent).

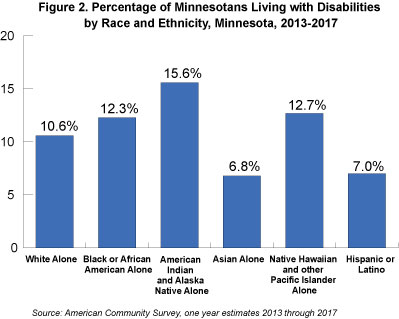
By race and ethnicity, American Indian and Alaska Natives have the highest prevalence of disability at 15.6 percent (Figure 2). Native Hawaiians and other Pacific islanders have the second highest prevalence at 12.7 percent, followed by blacks or African Americans (12.3 percent), and whites (10.6 percent). Hispanics and Asians have the lowest prevalence rates, at 7.0 and 6.8 percent respectively.

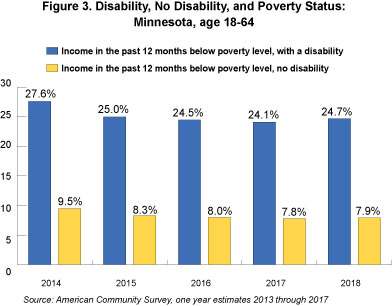
One of the best indicators of economic well-being and gaps in quality of life between sub-populations is poverty status. Living with a disability is associated with an alarmingly high poverty rate. In 2018, almost a quarter of the working-age population with one or more disabilities lived below the poverty line, compared to only 7.9 percent of those with no disability. Although poverty rates have fallen since 2014 for both those with disabilities and those who are temporarily able-bodied, the gap has endured over the past five years.

Living with a disability can create barriers to education, which in turn can create barriers to employment. Having a disability is associated with lower levels of educational attainment (Table 2). While 32.9 percent of Minnesotans with no disability finish their education at the high school level or less, the percentage jumps above 60 percent for people living with self-care, independent living and cognitive disabilities.
| Table 2. Educational Attainment by Disability Status in Minnesota, 2013-2017 | |||||
|---|---|---|---|---|---|
| With disability | Up to (and including) High School Diploma/GED | Some College, No Degree | Associate | Bachelor | Masters, Professional or Doctoral |
| Vision | 55.5% | 20.2% | 7.5% | 10.5% | 6.4% |
| Hearing | 52.6% | 20.8% | 7.3% | 12.2% | 7.0% |
| Ambulatory | 57.2% | 21.1% | 6.9% | 9.9% | 4.9% |
| Independent living | 63.1% | 18.5% | 5.7% | 8.5% | 4.3% |
| Self-care | 63.2% | 18.1% | 5.4% | 8.4% | 4.8% |
| Cognitive | 60.7% | 20.7% | 6.4% | 8.6% | 3.6% |
| No disability | 32.9% | 23.2% | 10.7% | 22.5% | 10.7% |
| Source: American Community Survey, one year estimates 2013-2017, and IPUMS online analyze data tool | |||||
People living with disabilities also tend to achieve lower levels of higher education. For example, while the bachelor's degree completion rate is 22.5 percent for Minnesotans with no disabilities, it is drastically lower for those with disabilities (Table 2). Those living with self-care difficulties have the lowest rate of bachelor's degree completion at 8.4 percent.
Compared to the overall Minnesota workforce, Minnesotans with a disability typically have lower levels of labor market participation, lower employment-to-population ratios, and substantially higher unemployment rates (Table 3). In 2018, the annual unemployment rate for Minnesotans living with a disability was 9 percent, more than double that of the general population, which was 3.4 percent.
On the positive side, the unemployment rate of Minnesotans with disabilities declined more rapidly between 2014 and 2018, down by 2.2 percentage points, than for the total population over the same time period, down 1.2 percentage points. The annual labor force participation rate in 2018 was 84 percent for all Minnesotans, but only 54.1 percent for Minnesotans living with disabilities. However, the labor force participation rate for Minnesotans living with disabilities increased 4.1 percentage points over the five-year period, up from 50 percent in 2014, whereas the participation rate for all Minnesotans has remained stagnant over the same time period (Table 3).
| Table 3. Labor Force Indicators for Working Age Population, Age 18 to 64, Minnesota | ||||||
|---|---|---|---|---|---|---|
| Labor Force Participation Rate | Employment to Population Ratio | Unemployment Rate | ||||
| Year | All | With Disability | All | With Disability | All | With Disability |
| 2018 | 84.0% | 54.1% | 81.2% | 49.1% | 3.4% | 9.0% |
| 2017 | 83.9% | 52.0% | 81.0% | 47.8% | 3.6% | 8.1% |
| 2016 | 83.8% | 52.3% | 80.6% | 48.0% | 3.7% | 8.2% |
| 2015 | 83.9% | 52.5% | 80.6% | 47.5% | 4.0% | 9.6% |
| 2014 | 83.4% | 50.0% | 79.6% | 44.4% | 4.6% | 11.2% |
| Source: American Community Survey, one year estimates 2014 through 2018 | ||||||
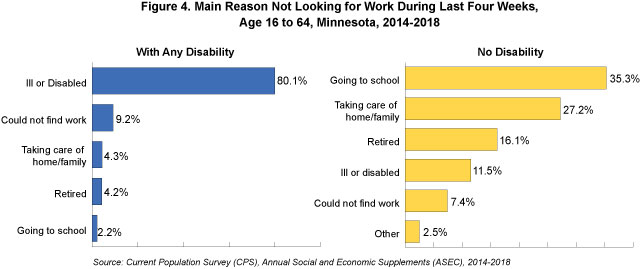
What employment barriers do people living with disabilities face? Figure 4 shows that among non-participants, 80 percent of disabled people cite ill health and disability as the reason for not working or looking for work compared to only 11.5 percent of those with no disability. Moreover, 9.2 percent of people living with disabilities were unable to find work compared with 7.4 percent of those with no disabilities. In contrast, non-participants without any disabilities are more likely to cite reasons such as going to school, family responsibilities, and retirement.

People living with a disability who are employed tend to work fewer hours and have lower earnings than those with no disability. Table 4 shows that 78.8 percent of employed people with no disability usually work full-time while only 52.7 percent of employed people living with a disability usually work full-time. In contrast, 47.3 percent of people living with a disability work part-time, compared to only 21.2 percent of those with no disability.
| Table 4. Usual Hours of Work Last Year by Disability Status, Minnesota, 2014-2018 | ||
|---|---|---|
| With Any Disability (%) | With No Disability (%) | |
| Usually full-time hours (35+ hours per week) | 52.7% | 78.8% |
| Usually part-time hours | 47.3% | 21.2% |
| Total | 100% | 100% |
| Source: Current Population Survey (CPS) Annual Social and Economic Supplements (ASEC), 2014-2018 | ||
Having a disability is associated with substantially lower earnings (Table 5). Among all labor force participants with earnings in 2018, those with no disability earned $40,370 annually at the median, while those living with disabilities earned only $23,000. By gender, females with disabilities have the lowest median earnings at $19,305, compared to females with no disabilities at $33,795. Males with disabilities earn $26,257 at the median, compared to $46,548 for males with no disabilities.
| Table 5. Median Earnings in Past 12 Months (2018 Inflation-Adjusted Dollars) by Disability Status and Sex, Civilian Non-institutionalized Population 16 Years and Over with Earnings, Minnesota | ||||||
|---|---|---|---|---|---|---|
| With a Disability | No Disability | |||||
| Year | All | Male | Female | All | Male | Female |
| 2018 | $23,000 | $26,257 | $19,305 | $40,370 | $46,548 | $33,795 |
| 2017 | $20,957 | $24,029 | $18,329 | $39,234 | $45,514 | $32,297 |
| 2016 | $19,767 | $21,914 | $16,767 | $37,142 | $42,423 | $31,378 |
| 2015 | $19,681 | $22,927 | $15,860 | $35,986 | $41,757 | $30,410 |
| 2014 | $19,253 | $23,632 | $14,638 | $35,184 | $41,189 | $29,732 |
| Source: American Community Survey, one year estimates 2014 through 2018 | ||||||
People living with disabilities in Minnesota tend to have lower educational attainment, worse labor market outcomes, and higher poverty rates than those with no disabilities. The critical takeaway is that people living with disability continue to face significant barriers to realizing their full economic potential.
We embrace our role in helping people with disabilities break down barriers to full and equitable employment in Minnesota.