by Sanjukta Chaudhuri
September 2017
Full-time female workers in Minnesota earn less than their male counterparts in all 20 industries that were examined.
Minnesota regularly ranks as a top state for women to live and work. A 2017 study by WalletHub rated Minnesota as the best state for women in terms of economic and social well-being.
Still, women in Minnesota earn less than their male counterparts, despite comprising 51.2 percent of the workforce. In 2015, the median hourly wage rate was $16.75 for women and $20 for men. This means that, at the median, women earned only 84 percent of men on an hourly basis.
Women, however, are more likely to work part time than men – a median of 384 hours per quarter compared with 480 hours per quarter for men. While this may explain some of the difference in hourly wage (full-time jobs tend to pay more), full-time female workers still earn only 85.5 percent of their male counterparts.
How does this 14.5 percent wage gap break down by industry? To begin to explore this question, this article provides an industry level analysis using the 20 aggregated NAICS industrial sectors.1 Only full-time workers between ages 25 and 65 are included in the analysis to ensure that the focus is on a relatively stable and established portion of the workforce.
The data source for this article is a statewide dataset called the Quarterly Employment Dynamics, which was recently developed cooperatively by DEED and the Minnesota Department of Public Safety. The article presents statewide data for 2015, the most recent year for which complete data are available.
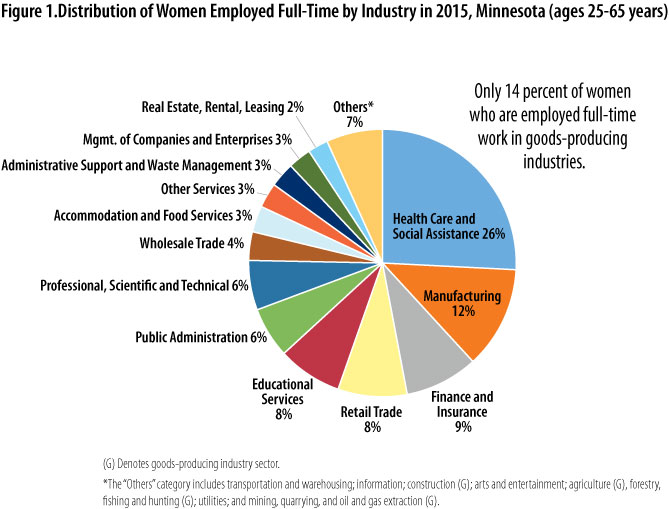
In Minnesota, 84 percent of women work full time in service-producing industries, while only 14 percent work in goods-producing industries (see Figure 1).

Over a quarter of women are employed in health care and social assistance, making this the dominant industry for employing women. Manufacturing comes in second (12 percent), followed by finance and insurance (9 percent), retail trade (8 percent), educational services (8 percent), professional, scientific and technical services (6 percent) and public administration (6 percent). Women comprise the majority of the workforce in four service-providing industries: health care and social assistance (74 percent are women), finance and insurance (59 percent), educational services (59 percent), and management of companies and enterprises (52 percent).
Table 1 shows a breakdown of median wages for men and women in the 20 industries that were analyzed. In every instance, women's median wage rates are lower than men's, with the gender wage ratio ranging from 95.5 percent in arts, entertainment and recreation to 64.2 percent in finance and insurance.
| NAICS Code | Industry | All-worker Median Wage Rate ($) | Male Median Wage Rate ($) | Female Median Wage Rate ($) | Gender Wage Ratio (%) | Gender Wage Gap (%) |
|---|---|---|---|---|---|---|
| 0 | All Industries | 25.30 | 27.00 | 23.08 | 85.5 | -14.5 |
| 11 | Agriculture, Forestry, Fishing and Hunting | 17.47 | 17.75 | 16.19 | 91.2 | -8.8 |
| 21 | Mining, Quarrying, and Oil and Gas Extraction | 29.64 | 29.81 | 27.45 | 92.1 | -7.9 |
| 22 | Utilities | 38.66 | 40.43 | 28.33 | 70.1 | -29.9 |
| 23 | Construction | 29.14 | 29.99 | 23.96 | 79.9 | -20.1 |
| 31-33 | Manufacturing | 23.78 | 24.82 | 20.82 | 83.9 | -16.1 |
| 42 | Wholesale trade | 27.09 | 27.64 | 25.57 | 92.6 | -7.5 |
| 44-45 | Retail Trade | 19.15 | 20.60 | 17.11 | 83.1 | -16.9 |
| 48-49 | Transportation and Warehousing | 22.53 | 23.04 | 20.63 | 89.6 | -10.5 |
| 51 | Information | 32.00 | 34.98 | 27.45 | 78.5 | -21.5 |
| 52 | Finance and Insurance | 33.32 | 43.37 | 27.79 | 64.2 | -35.9 |
| 53 | Real Estate and Rental and Leasing | 26.71 | 27.99 | 25.66 | 91.8 | -8.3 |
| 54 | Professional, Scientific and Technical Services | 34.93 | 39.34 | 29.49 | 75.0 | -25.0 |
| 55 | Management of Companies and Enterprises | 36.07 | 41.15 | 31.80 | 77.3 | -22.7 |
| 56 | Administrative and Support and Waste Management Services | 19.89 | 20.54 | 18.73 | 91.2 | -8.8 |
| 61 | Educational Services | 24.74 | 25.74 | 23.98 | 93.2 | -6.8 |
| 62 | Health Care and Social Assistance | 22.05 | 25.85 | 21.08 | 81.7 | -18.5 |
| 71 | Arts, Entertainment and Recreation | 20.31 | 20.69 | 19.77 | 95.5 | -4.4 |
| 72 | Accommodation and Food Services | 15.65 | 16.01 | 15.2 | 94.9 | -5.1 |
| 81 | Other Services, Except Public Administration | 21.46 | 23.37 | 18.93 | 81.0 | -19.0 |
| 92 | Public Administration | 28.02 | 29.29 | 26.45 | 90.3 | -9.7 |
| Source: Quarterly Employment Dynamics | ||||||
At the high end, the all-worker median wage rate is $38.66 hourly in utilities, $36.07 in management of companies and enterprises, $34.93 in professional, scientific and technical services, $33.32 in finance and insurance, and $32 in information.
At the low end, median wage rates are $19.89 in administrative and support and waste management services, $19.15 in retail trade, $17.47 in agriculture, and $15.65 in accommodation and food services.
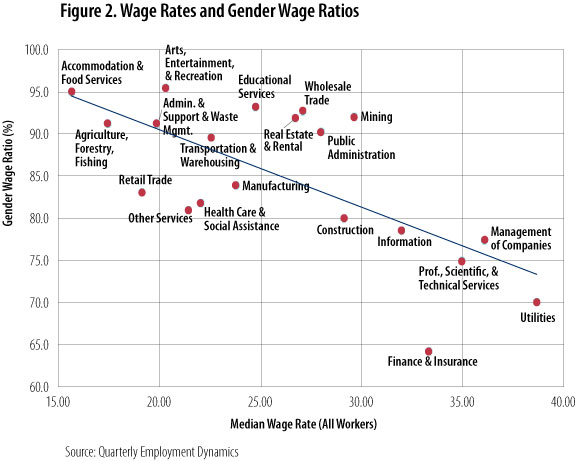
Figure 2 shows the scatter plot between median wage rate and gender wage ratios. The trend line shows a negative relationship between the two, meaning that women's wage rates as a percentage of men's wage rates decrease as the overall median wage rate increases.

Take the utilities sector as an example. While the all-worker median wage rate in this sector is $38.66, the median wage rate is $28.33 for women and $40.43 for men, leading to a gender wage ratio of 70.1 percent.
Other high-wage industries with high wage inequity include management of companies and enterprises (77.3 percent), professional, scientific and technical services (75 percent), finance and insurance (64.2 percent), and information (78.5 percent).
On the other hand, some of the lower-paying industries have relatively lower pay inequity, including art, entertainment and recreation (95.5 percent) administrative and support and waste management (91.2 percent) and accommodation and food services (94.9 percent).
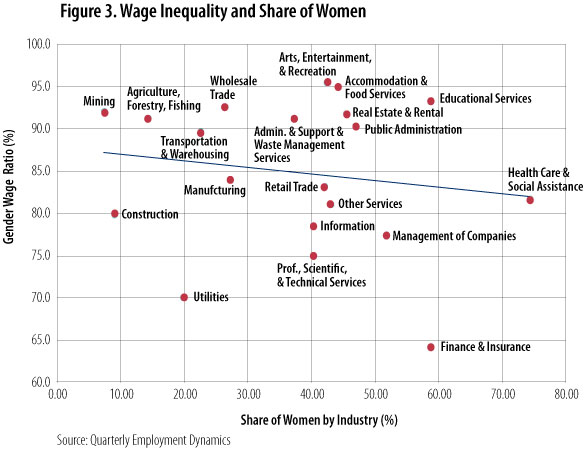
Figure 3 shows that as the share of women increases within an industry, gender wage ratios tend to worsen as illustrated by the negatively sloped trend line. Three out of four of the female-majority industries are characterized by high wage inequality including health care and social assistance (81.7 percent), finance and insurance (64.2 percent), and management of companies and enterprises (77.3 percent).

One practical application of these statistics is to help women make career decisions. Career choice naturally depends on a host of factors, including individual preferences, human capital and other life circumstances.
Based on the previous analysis, however, and setting aside all other considerations, if we were to rank industries by what women value most in a job, then the potential priorities driving choice of industry might be some combination of high wages and high-wage equality within the industry, and a high share of women in the industry to facilitate positive role modeling and mentoring.
Table 2 offers a short list of industries based on these hypothetical priorities and shows the main trade-offs to take into account. Unfortunately, no industry offers everything, and every industry involves trade-offs for women. A high-wage industry such as finance and insurance is plagued by high wage inequality; a female majority industry such as educational services may have ample female role models and mentors but is not a high-wage industry.
| High Wage Rate | Higher Wage Equality | Predominantly Female Co-workers |
|---|---|---|
| Finance and Insurance1 | Arts, Entertainment and Recreation3, 4 | Health Care and Social Assistance1 |
| Utilities1, 2, 4 | Accommodation and Food Services3, 4 | Finance and Insurance1 |
| Professional, Scientific and Technical Services1 | Educational Services3 | Management of Companies and Enterprises1, 4 |
| Management of Companies and Enterprises1, 4 | Educational Services3 | |
| Information1, 4 | ||
|
Main trade-offs: 1Higher wage inequality 2Women comprise small share of workers 3Relatively lower wage rate 4Relatively less popular choice among women |
||
How do we unpack the gender wage gap that persists in all industries, even the ones in which women are a majority?
There are various research directions one could take from here. For one, in-depth analysis of disaggregated industries will provide further nuances of wages and gender gaps. Second, industry level analyses hide the occupational differences in wage rates that might be a major underlying cause of the overall wage gap. Third, in order to fully understand the sources of wage gaps, we need to examine several other factors, including human capital differences (educational attainment, skills, relevant experience, productivity, tenure) between men and women; differences between labor market and family choices (college major, industry and occupation, family formation, breaks from workforce to raise family); and systemic issues such as lower rewards for equal work, career stalling, marriage and family penalty, glass ceilings, subtle prejudices and stereotyping.
Watch for further articles on this topic in Trends and Minnesota Employment Review.
1NAICS stands for North American Industry Classification System. This industry taxonomy was developed collaboratively by the U.S., Mexico and Canada to provide a consistent framework for the collection, analysis and dissemination of industrial statistics.