by Dave Senf
September 2018
Changes in the employment mix in Minnesota have narrowed the gap in LAUS and CES employment counts in recent decades.
DEED publishes two employment estimates each month based on two separate surveys.1 One is the household survey (also called the Current Population Survey) and the other is the payroll survey (also known as the Current Employment Statistics or CES survey). The household survey asks households about their employment status, while the payroll survey asks Minnesota employers how many workers they have on their payrolls.2
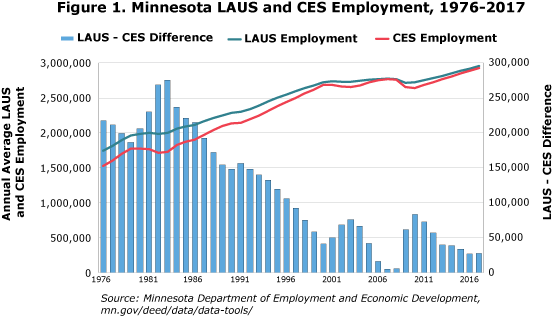
Minnesota payroll employment estimates are available back to 1950, while consistent household employment estimates (more commonly referred to as LAUS employment) start in 1976. Annual average LAUS employment in 1976 was 217,000 higher than annual average CES employment – a difference of about 14 percent. By last year, however, LAUS employment was only 27,000 higher than CES employment – a difference of 1 percent (see Figure 1).

While we like to think that our survey methods are producing better results today than four decades ago, LAUS and CES employment estimates have narrowed over the last four decades because of long-term changes in certain types of employment in Minnesota.
LAUS and CES numbers are designed to produce slightly different employment counts. LAUS estimates the total number of Minnesotans who are employed, while CES estimates the total number of nonfarm wage and salary jobs in the state. Table 1 lists the major differences between the two employment estimates.
| CES Employment | LAUS Employment |
|---|---|
| Based on payroll survey | Based on household survey |
| Count of jobs | Count of Minnesotans employed |
| Place of work | Place of residence |
| Excludes self-employed workers | Includes self-employed workers |
| Excludes agricultural jobs | Includes agricultural workers |
| Counts multiple-job holding | Ignores multiple-job holding |
LAUS numbers include agricultural jobs and self-employment jobs, while CES numbers exclude both of these employment types. People who hold multiple jobs are counted only once in LAUS, while CES includes all nonfarm wage and salary jobs held by a worker. For example, a Minnesota worker who answers the household survey by saying her primary job is being a self-employed farmer while also working weekends as a bartender and one day a week as a substitute teacher would be counted differently in the two surveys. She would be counted once in the LAUS estimate (farm work) and twice in the CES estimate (bartender and substitute teaching work).
Another key difference is the place of work versus place of residence. Let's say the farmer above lives and farms in Minnesota just north of the Iowa border. Thus her farm job is counted in Minnesota's LAUS total. But her bartending and teaching jobs, if they were in Iowa, would not be counted in Minnesota's CES numbers. They would be tallied instead in Iowa's CES total.
The nonfarm wage and salary jobs held by people from Iowa, South Dakota, North Dakota or Wisconsin who commute to Minnesota for work are counted in Minnesota's CES but not in Minnesota's LAUS. Nonfarm payroll jobs held by Minnesotans who commute out of the state for work are included in Minnesota LAUS numbers but not in Minnesota's CES numbers.
The four-decade trend of the two employment measures converging at the state level is the result of self-employment, people holding multiple jobs and agricultural jobs shrinking as a percent of employment. A slight uptick in the net flow of interstate commuting (more workers commuting into Minnesota than out of Minnesota than in the past) also is a factor.
A higher percentage of working Minnesotans are employed in nonfarm wage and salary positions (CES employment), a lower percentage of Minnesotans hold multiple jobs, and a lower percentage are working in agricultural and self-employed jobs (LAUS employment) than four decades ago. The net effect is that LAUS and CES estimates have nearly converged even though there are important differences between the two estimates.
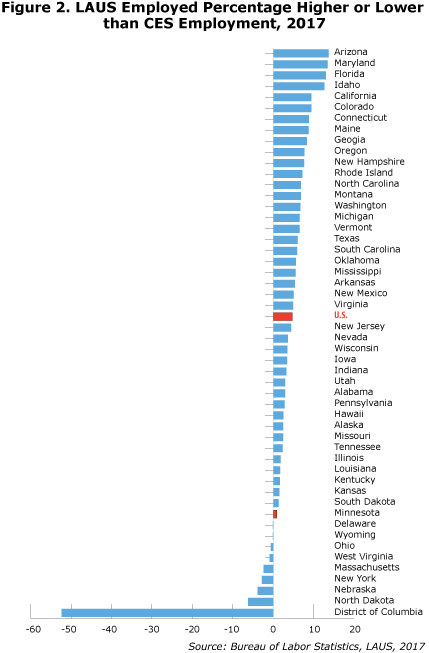
Minnesota's LAUS estimate is closer to its CES estimate than most states (see Figure 2). Nationally LAUS employment is nearly 7 million more (5 percent higher) than CES employment because agricultural employment and self-employment is included in LAUS but not in CES. National LAUS employment was 30 percent higher than CES employment in 1948. Declining farm employment and self-employment rates over the last 70 years account for the declining difference in the two employment measures.

Commuting has almost no role at the national level but plays a significant role in explaining the LAUS-CES difference in many states. LAUS employment for Washington, D.C., in 2017 was more than 50 percent smaller than CES employment. Most of the difference was Marylanders and Virginians commuting into D.C. for work. Maryland's LAUS number, on the other hand, was 13.4 percent higher than its CES number in part because of commuting into work in Washington, D.C. Maryland commuters are counted in that state's LAUS total but not its CES total.
Arizona had the largest gap between LAUS and CES estimates in 2017, with its LAUS employment 13.7 percent larger than CES employment. The number of Arizonians who commute to neighboring states for work is twice as large as the number of workers from other states who commute into Arizona. The state also has a higher-than-average percentage of farm workers and self-employed.
North Dakota's farm employment accounts for a larger percentage of total employment than in Arizona, and its self-employment rate is also higher than Arizona, yet its LAUS estimate is below the CES estimate. The reason is because North Dakota has three times as many workers commuting from other states as North Dakotans commuting out of state for work. North Dakota's rate of multiple job holders is also among the highest, while Arizona's rate is among the lowest.
For people who closely watch both the LAUS and CES monthly employment estimates, knowing why the two series differ and how the gap between the two series has been shifting will aid in understanding the ups and downs of Minnesota's employment.