Luke Greiner and Mark Schultz
March 2021
The COVID-19 pandemic created polarizing effects for the workers of Southwest Minnesota, with certain industries, age groups, and one gender suffering more than others. Comparing employment details proves just how concentrated and complex these employment disruptions were in the region.
Job losses in the second quarter were largely focused in Accommodation and Food Services, Educational Services, Health Care and Social Assistance, Retail Trade, and Manufacturing, with all five industries losing more than 1,500 jobs from the first quarter of 2020. However, while Manufacturing and Retail Trade both bounced back quickly in the third quarter of 2020, the still crippled Educational Services, Health Care and Social Assistance, and Accommodation and Food Services industries remained well below typical employment levels.
The industries that were hardest hit provide insight into the demographics of the employment disruption. This article will focus on the age and gender of employment changes from the second quarter of 2019 to the second quarter of 2020. Figure 1 illustrates the disproportionate disruption experienced by young workers, accounting for a significantly larger share of job loss than their share of employment.
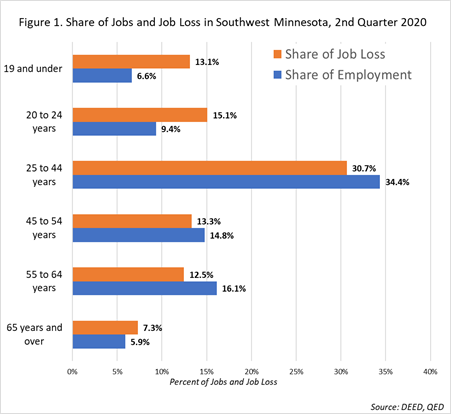
As has been detailed in many reports, the largest percentage losses were suffered in Accommodation and Food Services, Other Services, and the Arts, Entertainment, and Recreation industries, which have a prevalence of low-wage, customer-facing jobs. Teenagers in Southwest Minnesota hold just 6.5% of jobs, but they are more heavily relied on in these industries and hold a much larger share of jobs. For instance, in the Accommodation and Food Services industry, teenagers hold more than one in five jobs (21%).
Likewise, the sector provides 22% of jobs held by teenagers overall, as well as 12.4% of total jobs for workers aged 20 to 24 years, but less than 6% for all other age cohorts. In other words, Accommodation and Food Services provides a first job to many workers, building foundational skills and work habits. In the related Arts, Entertainment, and Recreation industry, teenagers held 15.7% of jobs, but the industry also has far fewer jobs in the region. Both of these industries cut thousands of jobs in early 2020, and as a result, Southwest Minnesota's newest workers are off to a shaky start on their path to workforce success.
While teenage employment is overrepresented in the two hardest hit sectors, their share of job loss was proportionate in the Accommodation and Food Services industry, but 77% higher than expected in the Arts, Entertainment, and Recreation industry based on the share of jobs they hold in the industry.
Teenage employment fell by a substantially disproportionate amount in Manufacturing, where they accounted for just 2% of jobs but suffered 12% of job decline in the industry – five times higher than expected. In fact, all age cohorts younger than 55 years were overrepresented in job losses at Manufacturers in Southwest Minnesota. Conversely, older workers fared substantially better than expected.
Losses concentrated in jobs held by teenagers also occurred in Public Administration, where they were eight times more likely to lose a job than expected based on their share of employment, amounting to a five percentage point decline in the share of Public Administration jobs held by teenagers. This likely included a lot of summer jobs in parks and recreation departments.
Meanwhile, jobs held by middle-aged workers (45-54 years) were less impacted than expected in most industries in the region, with the exception of the Retail Trade industry where this group's share of job loss was 1.2 times higher than its share of employment. The oldest worker cohort (65+ years) had slightly more job loss than expected, but those jobs were shed primarily from the Educational Services and Health Care and Social Assistance industries. In five industries the oldest cohort increased their share of jobs despite the turmoil occurring from the pandemic in the second quarter of 2020.
Related to job losses from the pandemic are reduced working hours. In Southwest Minnesota the overall median hours worked in the second quarter of 2020 held steady compared to the prior year. There were, however, large differences for the youngest workers. Because the median hours worked excludes jobs with no reported hours (there must be reported hours in order to be counted as a job), layoffs that were concentrated in part-time positions increased the median hours worked.
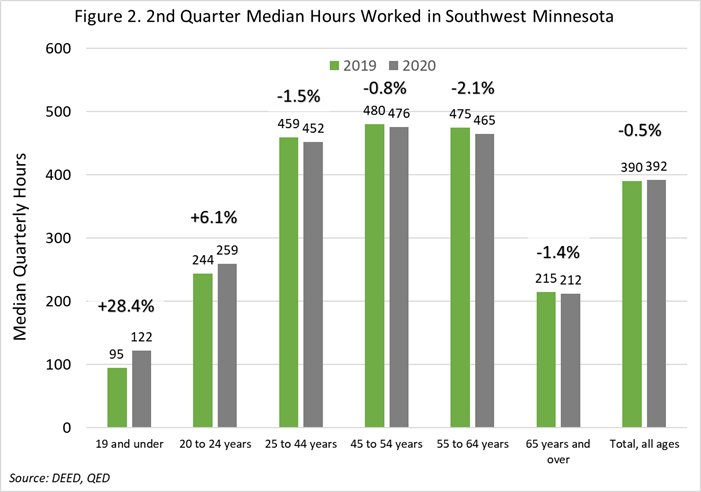 As seen in Figure 2, teenagers again experienced the largest disruption, and this suggests that their job losses were mostly in part-time positions. The same is also true for workers from 20 to 24 years, albeit less concentrated. For older workers, it appears that job losses were more evenly distributed among full and part-time positions. Unfortunately, the level of detail available prevents this from being entirely conclusive, so it's likely that some of the shift in hours worked were caused by changes in work schedules, not from changes in the distribution of job losses between full and part-time jobs. Despite not knowing the exact amount of job losses in full and part-time positions, it's clear that losses in the labor market were experienced by younger workers at far greater rates than older workers.
In addition to age group, DEED's Quarterly Employment Demographics also provides details on gender. The remainder of this article will focus on trends in percent of total jobs, median hourly wage, and median hours worked per quarter for males and females.
| Industry Sector | Percent of Total Jobs | Median Hourly Wage | Median Hours per Quarter | |||
|---|---|---|---|---|---|---|
| Male | Female | Male | Female | Male | Female | |
| Total, All Industries | 48.8% | 51.2% | $20.84 | $16.59 | 460 | 359 |
| Agriculture, Forestry, Fishing, and Hunting | 74.9% | 25.1% | $18.75 | $17.16 | 483 | 441 |
| Mining | 89.4% | 10.6% | $24.99 | $29.65 | 477 | 420 |
| Utilities | 79.2% | 20.8% | $41.84 | $28.65 | 528 | 520 |
| Construction | 88.2% | 11.8% | $24.48 | $19.59 | 475 | 361 |
| Manufacturing | 67.7% | 32.3% | $22.11 | $18.57 | 480 | 455 |
| Wholesale Trade | 79.8% | 20.2% | $23.75 | $19.49 | 520 | 480 |
| Retail Trade | 48.2% | 51.8% | $14.57 | $13.97 | 292 | 233 |
| Transportation and Warehousing | 78.1% | 21.9% | $20.91 | $18.00 | 395 | 252 |
| Information | 49.5% | 50.5% | $24.52 | $18.85 | 520 | 481 |
| Finance and Insurance | 32.0% | 68.0% | $37.61 | $22.98 | 480 | 480 |
| Real Estate and Rental and Leasing | 45.8% | 54.2% | $17.26 | $15.67 | 345 | 400 |
| Professional and Technical Services | 46.2% | 53.8% | $29.78 | $20.83 | 480 | 476 |
| Mgmt. of Companies and Enterprises | 54.4% | 45.6% | $26.39 | $23.27 | 480 | 472 |
| Administrative and Waste Services | 69.4% | 30.6% | $19.06 | $14.83 | 387 | 243 |
| Educational Services | 28.7% | 71.3% | $32.22 | $24.91 | 378 | 350 |
| Health Care and Social Assistance | 18.2% | 81.8% | $16.04 | $16.97 | 397 | 365 |
| Arts, Entertainment, and Recreation | 48.9% | 51.1% | $12.50 | $12.67 | 142 | 72 |
| Accommodation and Food Services | 38.7% | 61.3% | $11.88 | $11.69 | 117 | 81 |
| Other Services | 47.1% | 52.9% | $18.45 | $15.06 | 383 | 135 |
| Public Administration | 53.0% | 47.0% | $25.00 | $24.22 | 480 | 480 |
| Source: DEED Quarterly Employment Demographics | ||||||
In sum, the breakdown of percent of total jobs across all industries is fairly even, with males filling 48.8% of the total jobs in the region while the remaining 51.2% are filled by females. While things are relatively even when we look at percent of total jobs, large discrepancies exist in the remaining two categories – median hourly wage and median hours worked per quarter. According to the QED data, males earn a median wage of almost $21 per hour while females are earning $16.59, a difference of $4.25 or 20.4% across all industries. By industry sector, the largest differences in median hourly wages between genders occur in Finance and Insurance (-$14.63) and Utilities (-$13.19).
Recent gender pay gap research from various organizations suggests that wage gaps exist in the labor market because women tend to choose jobs that offer more flexible hours than those chosen by men and that these jobs typically pay less than jobs with longer and more rigid hours (Goldin). This pattern is evident in Southwest Minnesota when we look at median hours worked per quarter, with females working considerably fewer hours (359) compared to their male counterparts (460) across all industries. The largest divergences are seen in Other Services, where females work 248 fewer hours than males each quarter, and Administrative Support and Waste Management Services and Transportation and Warehousing, which both show females working about 140 less hours per quarter than males.
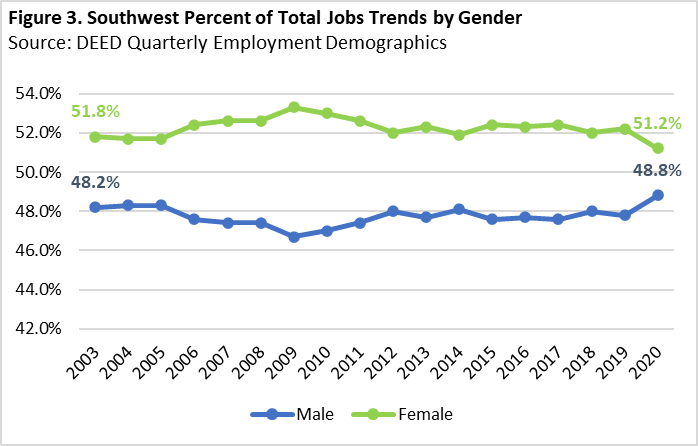 Despite some minor changes throughout the years, females have consistently held a slightly higher percent of the total regional jobs than males from the second quarter of 2003 to the second quarter of 2020. Given that the percentages for males and females must equal 100%, the trends show mirror images, with the percent of males bottoming out at 46.7% in 2009, leaving the remaining 53.3% of the jobs occupied by females. With the significant job losses for females during the pandemic recession, the percent of males saw its largest increase, jumping from 47.8% to 48.8%, from 2019 to 2020. One possible reason for this large decline for females is that COVID-19 mandated closures of schools could have led to more females leaving their jobs to care for children in the home (see Figure 3).
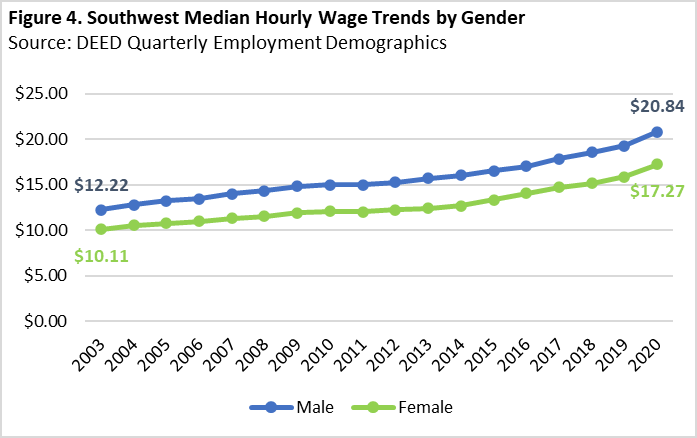 The median wages for both males and females saw a consistent increase over the years. As shown in Figure 4, median wages were always higher for males. The median wages for males increased by $8.62 from 2003 to 2020, an increase of 70.5%. On the other hand, females saw a slightly higher percentage increase (70.8%); however, when put into dollars this was a smaller increase than males saw, with female wages increasing by $7.16 per hour. One startling revelation that the data show is that over the years, the median wage gap between males and females has increased, going from $2.11 in 2003 to $3.57 in 2020. Even during the pandemic in the last year (second quarter 2019 to second quarter 2020), both males and females experienced wage increases to the tune of $1.57 and $1.42, respectively, as many low wage jobs were either temporarily or permanently eliminated by mandated shut downs.
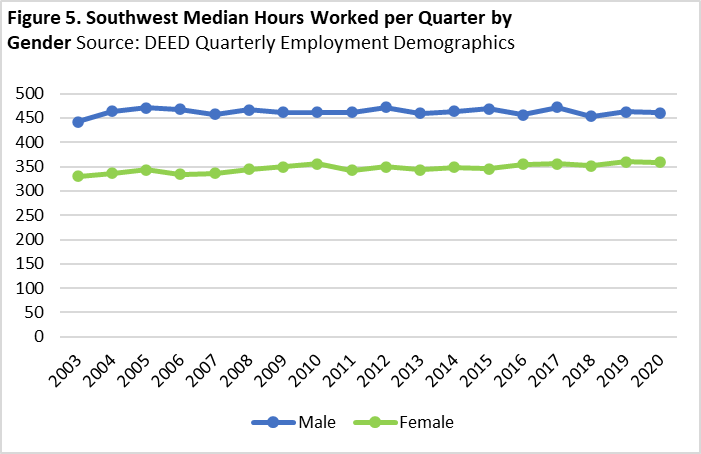 Because of the different industries and occupations they work in, males have worked more hours than females consistently since 2003. As shown in Figure 5, however, the gap in median hours worked has decreased overall. In 2003 males worked 112 more hours per quarter than females, and this number had dropped to 101 in 2020. In the last year (second quarter 2019 to second quarter 2020), both males and females experienced a minor decrease in the median hours worked per quarter, with males dropping by three hours and females seeing a decline of one hour. This seems small in comparison to the size of the economic disruptions suffered across industries in the region.