
by Tim O'Neill
June 2021
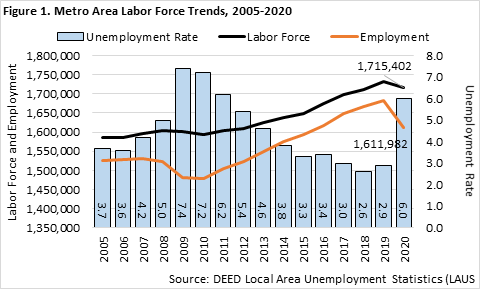 The Seven-County Metro Area's labor force shifted dramatically over the course of 2020. On an annual basis, the region's total labor force size dropped by 0.9%, or 16,100 persons. This labor force drop, however, hides much more dramatic employment and unemployment trends between 2019 and 2020. More specifically, the region's total employment declined by 4.1% (69,100 persons), while total unemployment spiked upwards by 105.0% (52,981 persons) (Figure 1).
Annually, the Metro Area's unemployment rate increased from 2.9% in 2019 to 6.0% in 2020. On a monthly basis, the unemployment rate hit 10.1% in May 2020, which represented approximately 172,300 unemployed persons. This was more than three times the number of unemployed persons in the months leading up to the onset of the COVID-19 pandemic.
As of April 2021, the Metro Area's labor force has shown significant signs of recovery. After jumping up and down in the early months of the pandemic and then declining to close out the year, the region's workforce increased by approximately 32,200 persons between January and April 2021, suggesting a return to labor force growth. This was due to an increase in employment of 39,500 persons, and a decrease of unemployment of 7,300 persons - showing that people were coming back into the labor force and getting jobs. As of April 2021, the unemployment rate for the Metro Area equaled 4.1%. This represented approximately 69,100 persons, down well over half compared to one year prior.
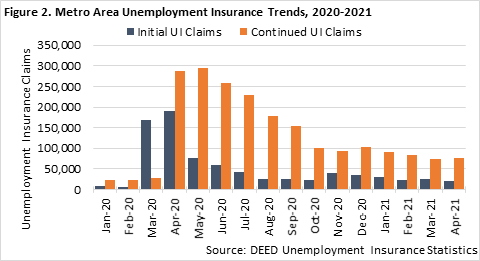 Along with major labor force shifts came major spikes in claims for Unemployment Insurance (UI) during the pandemic. Between February and March 2020, initial claims for UI in the Metro Area increased by nearly 2400%. In other words, such claims were about 25 times higher in March 2020 than they were one month previous. Such claims would top out at nearly 190,500 in April 2020, before steadily declining through October of that year. Meanwhile, continued claims for UI peaked at nearly 300,000 in May 2020. While initial and continued UI claims did increase slightly during the winter months of 2020, they have declined through the beginning months of 2021. In April 2021, there were approximately 21,300 initial and 76,300 continued claims for UI (Figure 2). While down drastically from April 2020, these claims are still up from pre-pandemic times. Initial UI claims and continued UI claims in April 2021 are up about 238% and 321% from April 2019, respectively.
Throughout the course of the COVID-19 pandemic, the share of UI claims has been disproportionately among Black, Indigenous and People of Color (BIPOC) metro residents. This continued to be the case as recently as April 2021. As of that month, the share of continued UI claims filed by white workers was 56.2%, where that population makes up 79.0% of the region's labor force. The Black or African American share of continued UI claims was 24.6%, where that population makes up 8.5% of the region's labor force.
Quarterly Census of Employment and Wages (QCEW) data can provide a thorough examination of the Seven-County Metro Area's employment landscape. Looking at annual averages for 2020, the Metro Area had 86,401 establishments supplying 1,643,484 covered jobs. As such, the Metro Area accounts for three-fifths (60.7%) of Minnesota's total employment. Top-employing major industry sectors in the region include Health Care & Social Assistance (270,069 jobs), Manufacturing (166,270 jobs), and Retail Trade (152,212 jobs). Those regional industry sectors accounting for a higher share of statewide employment include Management of Companies (88.1% of statewide employment); Professional, Scientific, & Technical Services (78.3%); Finance & Insurance (77.9%); Real Estate, Rental & Leasing (77.1%); and Administrative & Support Services (70.3%). Total payroll across all industries in the region equaled $117.6 billion in 2020, with the average annual wage at $71,500 (Table 1).
Table 1. Seven-County Metro Area Industry Statistics, Annual 2020 (Sorted by Number of Jobs)
| Industry | Number of Establishments | Number of Jobs | Share of MN Jobs | Total Payroll ($1,000s) | Avg. Annual Wage |
|---|---|---|---|---|---|
| Total, All Industries | 86,401 | 1,643,484 | 60.7% | $117,643,062 | $71,500 |
| Health Care and Social Assistance | 11,622 | 270,069 | 55.5% | $15,178,305 | $56,108 |
| Manufacturing | 4,065 | 166,270 | 53.8% | $13,463,146 | $80,912 |
| Retail Trade | 8,571 | 152,212 | 55.0% | $5,558,064 | $36,504 |
| Educational Services | 2,220 | 128,073 | 58.8% | $7,712,089 | $60,268 |
| Professional, Scientific, and Technical Services | 11,345 | 121,357 | 78.3% | $13,006,106 | $107,120 |
| Finance and Insurance | 4,906 | 114,577 | 77.9% | $14,431,297 | $125,892 |
| Accommodation and Food Services | 6,178 | 101,881 | 57.4% | $2,349,112 | $22,984 |
| Administrative and Support Services | 4,353 | 85,363 | 70.3% | $4,081,332 | $47,840 |
| Management of Companies | 922 | 76,575 | 88.1% | $10,434,025 | $136,136 |
| Wholesale Trade | 5,004 | 74,836 | 60.0% | $6,929,686 | $92,560 |
| Construction | 6,758 | 73,007 | 55.7% | $5,848,805 | $80,080 |
| Public Administration | 793 | 70,979 | 53.7% | $5,163,856 | $72,800 |
| Transportation and Warehousing | 2,008 | 68,629 | 65.6% | $4,308,806 | $62,660 |
| Other Services (except Public Administration) | 9,549 | 48,068 | 62.1% | $2,105,477 | $44,096 |
| Information | 1,738 | 32,150 | 68.9% | $3,129,899 | $97,344 |
| Real Estate and Rental and Leasing | 4,209 | 26,162 | 77.1% | $1,662,153 | $63,492 |
| Arts, Entertainment, and Recreation | 1,729 | 23,410 | 63.7% | $1,291,719 | $56,680 |
| Utilities | 109 | 6,210 | 46.5% | $805,241 | $129,636 |
| Agriculture, Forestry, Fishing and Hunting | 291 | 3,123 | 13.7% | $125,991 | $40,404 |
| Mining | 36 | 528 | 9.6% | $57,954 | $111,748 |
| Source: DEED Quarterly Census of Employment and Wages (QCEW) | |||||
Digging into employment trends for these major industries begins to reveal how the Metro Area's economy was affected by COVID-19. For example, the Arts, Entertainment & Recreation industry lost the greatest share of employment (-58.0%) at the height of COVID-19's impact during the second quarter of 2020. Accommodation & Food Services (-47.4%) and Other Services (-34.8%) were also severely impacted. Administrative & Support Services (-20.7%) and Retail Trade (-17.0%) rounded out the major industries that lost higher shares of their respective employment than the total of all industries (-13.1%) in the region between the second quarters of 2019 and 2020 (Figure 3).
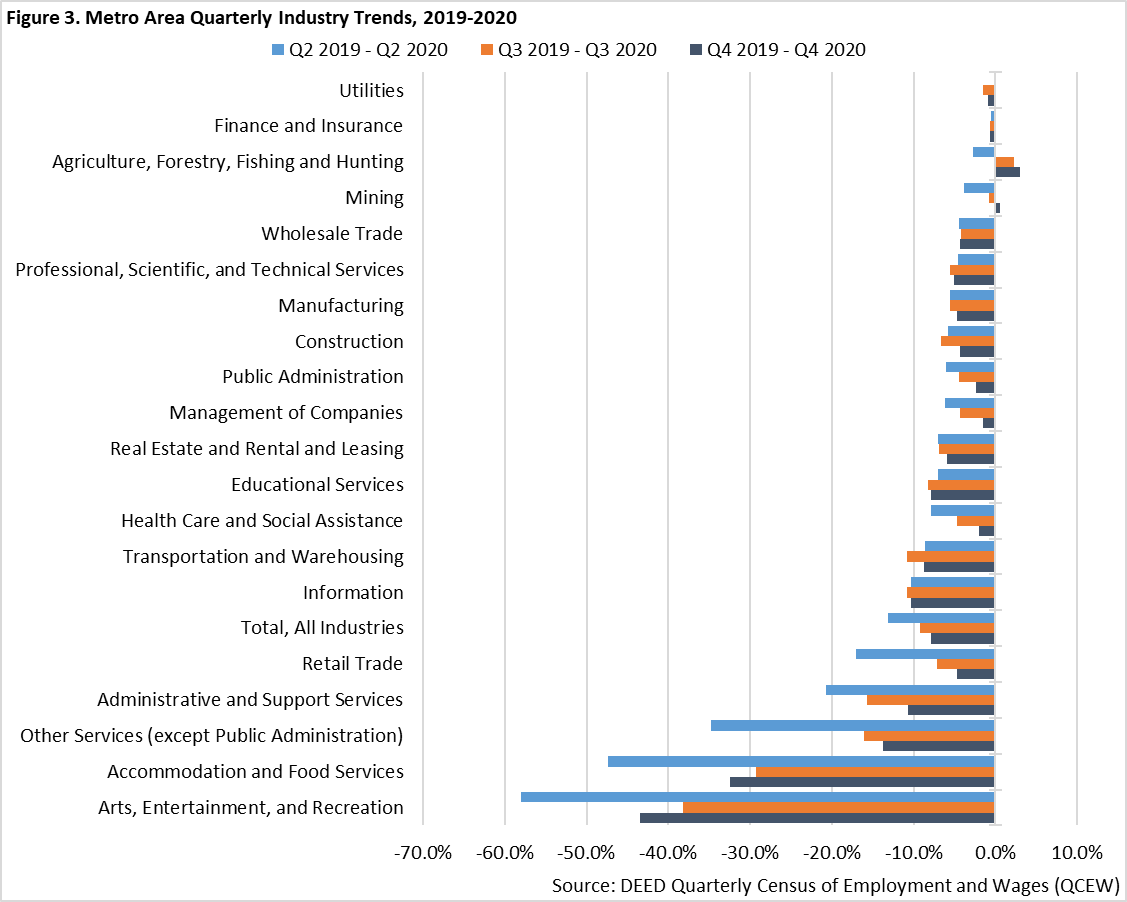
Nearly every major industry sector witnessed improved employment numbers through the third and fourth quarters of 2020. However, as COVID-19 cases spiked and new restrictions to curb the spread of the virus were put in place at the end of 2020, Arts, Entertainment & Recreation and Accommodation & Food Services experienced greater over-the-year losses during the fourth quarter. Overall, the Metro Area's total over-the-year employment losses decreased from 13.1% in the second quarter to 9.2% in the third quarter to 7.9% in the fourth quarter, showing the region's recovery progress.
When zooming in upon detailed industries, top-employing sectors for the Metro Area include Restaurants (83,234 jobs during annual 2020); Elementary & Secondary Schools (78,213 jobs); Management of Companies (76,575 jobs); General Medical & Surgical Hospitals (63,307 jobs); Individual & Family Services (51,347 jobs); Depository Credit Intermediation (39,052 jobs); Employment Services (37,401 jobs); Colleges, Universities, & Professional Schools (34,197 jobs); Insurance Carriers (32,673 jobs); and Offices of Physicians (31,289 jobs). Altogether, these ten subsectors accounted for nearly one-third (32.1%) of the Metro Area's total employment in 2020.
As described for the major industry sectors, there is no doubt that particular subsectors were more impacted than others by COVID-19. Table 2 lists those in-depth industries losing the most jobs between 2019 and 2020 in the Metro Area. With these industries experiencing such losses, the Metro Area did lose a greater share of its total employment between annual 2019 and 2020 (-7.5%) than the state did overall (-6.7%).
It should be noted that most of those industries losing significant employment over the course of 2020 had lower average annual wages. More specifically, of the top 20 industries losing the most jobs between 2019 and 2020, 16 had lower average annual wages than the average for the total of all industries (Table 2). This enforces the fact that COVID-19 had a disproportionate impact upon lower-paying industries and occupations in the region.
Table 2. Metro Area In-Depth Industries Losing the Most Jobs, Annual 2019-2020 (Sorted by Numeric Change in Jobs)
| Industry | Number of Establishments | Number of Jobs | Avg. Annual Wage | Change in Jobs 2019 – 2020 | |
|---|---|---|---|---|---|
| Numeric | Percent | ||||
| Total, All Industries | 86,401 | 1,643,484 | $71,500 | -132,607 | -7.5% |
| Restaurants | 4,944 | 83,234 | $20,956 | -26,460 | -24.1% |
| Employment Services | 726 | 37,401 | $46,124 | -7,452 | -16.6% |
| Traveler Accommodation | 353 | 10,113 | $36,296 | -6,610 | -39.5% |
| Other Amusement and Recreation Industries | 967 | 14,272 | $24,388 | -6,407 | -31.0% |
| Special Food Services | 566 | 5,719 | $31,668 | -4,395 | -43.5% |
| Elementary and Secondary Schools | 964 | 78,213 | $57,564 | -3,239 | -4.0% |
| Civic and Social Organizations | 397 | 5,378 | $27,300 | -3,061 | -36.3% |
| Clothing Stores | 792 | 7,508 | $22,672 | -2,820 | -27.3% |
| Personal Care Services | 1,588 | 9,589 | $30,784 | -2,533 | -20.9% |
| Other Schools and Instruction | 710 | 7,031 | $26,520 | -2,511 | -26.3% |
| Management of Companies and Enterprises | 922 | 76,575 | $136,136 | -2,326 | -2.9% |
| Scheduled Air Transportation | 24 | 11,143 | $95,472 | -2,153 | -16.2% |
| Offices of Physicians | 1,032 | 31,289 | $107,068 | -1,994 | -6.0% |
| General Medical and Surgical Hospitals | 62 | 63,307 | $73,684 | -1,950 | -3.0% |
| Promoters of Performing Arts, Sports, and Similar Events | 119 | 1,255 | $43,732 | -1,937 | -60.7% |
| Executive, Legislative, and Other General Government Support | 266 | 30,570 | $69,368 | -1,929 | -5.9% |
| Department Stores | 138 | 13,169 | $23,816 | -1,918 | -12.7% |
| School and Employee Bus Transportation | 83 | 5,016 | $30,108 | -1,804 | -26.5% |
| Child Day Care Services | 779 | 10,375 | $28,132 | -1,755 | -14.5% |
| Vocational Rehabilitation Services | 130 | 4,952 | $35,620 | -1,674 | -25.3% |
| Source: DEED Quarterly Census of Employment and Wages (QCEW) | |||||
 While most industries did lose employment over the course of 2020, there were some industries that gained jobs on an annual basis. Among these subsectors with the most positive employment growth include Individual & Family Services (+2,121 jobs), General Merchandise Stores (+897 jobs), Warehousing & Storage (+890 jobs), Software Publishers (+869 jobs); Couriers (+623 jobs), Medical & Diagnostic Laboratories (+602 jobs), Medical Equipment & Supplies Manufacturing (+594 jobs), and Educational Support Services (+575 jobs).
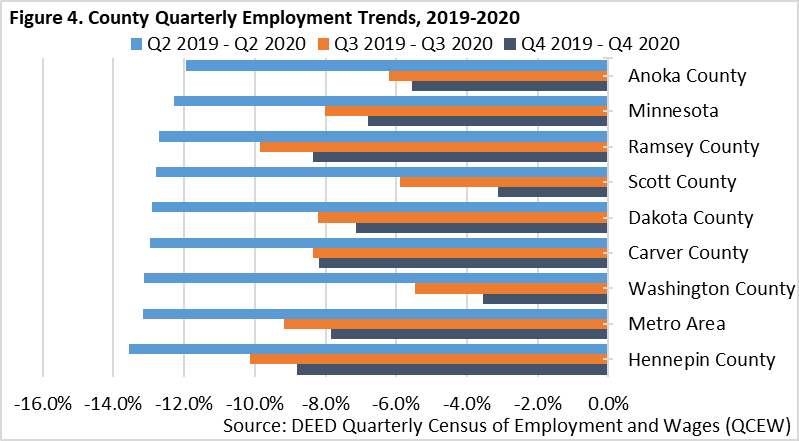
All counties within the Metro Area witnessed employment losses during 2020. These losses were most severe between the second quarters of 2019 and 2020, ranging from an -11.9% loss for Anoka County to a -13.6% loss for Hennepin County. Between the third quarters of 2019 and 2020, employment losses improved significantly for Washington County (-5.5%), Scott County (-5.9%), and Anoka County (-6.2%). Losses continued to improve most significantly for Scott County (-3.1%) and Washington County (-3.5%) between the fourth quarters of 2019 and 2020 (Figure 4). Numerically, Hennepin County accounted for over half (56.9%) of the Metro Area's annual employment losses between 2019 and 2020, with Ramsey County accounting for another fifth (19.7%) of the region's losses during that time.
Despite major shifts in the Metro Area's labor force and industry employment over the course of 2020, hiring demand remained strong. In fact, while vacancies understandably dipped through the second quarter of 2020, they bounced back past 75,700 vacancies during the fourth quarter of that year. This virtually matched the number of job vacancies from one year previous and represented the region's fourth-highest number of job vacancies since DEED's Job Vacancy Survey started in 2001 (Figure 5).
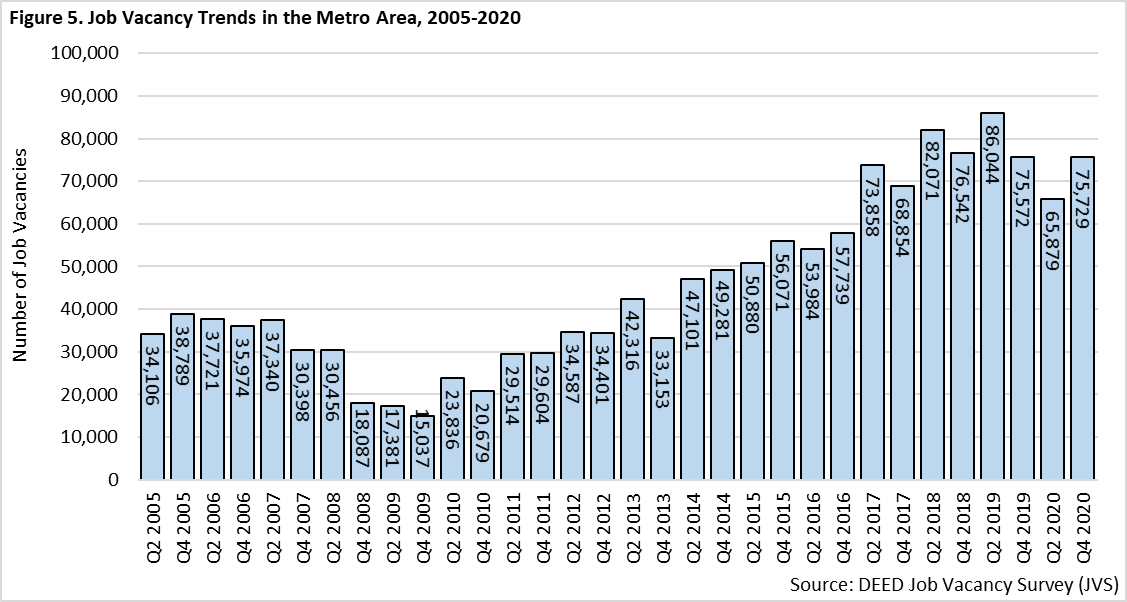
While total job vacancies in the Metro Area returned to normal levels during the fourth quarter of 2020, there were significant changes among the number of vacancies by major occupational groups. Most notably, Personal Care & Service Occupations as well as Food Preparation & Serving Occupations witnessed severe drops in vacancies over that period. At the same time the Healthcare Support, Healthcare Practitioners, Sales & Related, and Transportation & Material Moving occupational groups witnessed large increases in vacancies over the year. Those occupational groups that experienced steep job vacancy losses during the second quarter of 2020 followed by equally steep increases during the fourth quarter of 2020 include Computer & Mathematical; Sales & Related; Office & Administrative Support; Installation, Maintenance & Repair; and Production. The industries with the most job vacancies during the fourth quarter of 2020 included Health Care & Social Assistance (17,100 vacancies), Wholesale Trade (12,000 vacancies), Retail Trade (9,800 vacancies), Accommodation & Food Services (7,000 vacancies), Manufacturing (6,500 vacancies), and Professional & Technical Services (6,400 vacancies).