by Rachel Vilsack and Cameron Macht
April 2015
Every month, with the release of the unemployment rate, we get an up-to-date snapshot of how the state and national labor markets are changing. This information helps us track trends and compare economic conditions in Minnesota and across the U.S.. Recent updates have shown steadily increasing employment alongside rapidly falling unemployment rates.
Overall, economic conditions in the state are favorable. Minnesota's unemployment rate has stayed at least 1.5 percent below the U.S. rate every month since the heart of the recession in July 2009 and was at least 2 percent lower than the national rate in over three-fourths of the last 66 months. Likewise, Minnesota's average annual unemployment rate was 4.1 percent in 2014, which was over 2 percent below the national rate of 6.2 percent. Minnesota had the fifth lowest unemployment rate in the U.S. in 2014, according to the Bureau of Labor Statistics (BLS).
While Minnesota's unemployment rate displays an improving economy and labor market, it doesn't tell the whole story. Using data from the Current Population Survey (CPS), DEED has started providing alternative measures of unemployment by looking at race, age, and gender and by looking beyond the traditional unemployment rate. Although the data are updated monthly, they are presented as 12-month moving averages to mitigate seasonal changes and short-term fluctuations.
Breaking down unemployment rates for these different groups reveals that some communities are facing greater challenges in the labor market than others. Unemployment rates have been dropping, but were still higher for the following groups in Minnesota: Teenagers, people with lower educational attainment, Blacks or African Americans, and Hispanics or Latinos.
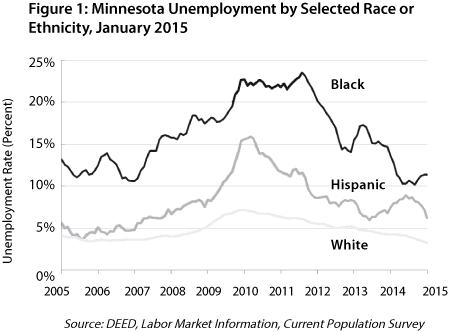
Moving into January 2015, unemployment rates for teenagers in Minnesota tumbled to 10.2 percent from 14.8 percent just 12 months prior. The rates turned down from 13.6 percent to 11.4 percent for Blacks or African Americans and from 7.5 percent to 6.2 percent for Hispanics or Latinos. Unemployment rates also dropped for whites from 4.2 percent in January 2014 to 3.2 percent in January 2015 (Figure 1).
The Current Population Survey, sponsored by BLS and the Census Bureau, is the primary source of labor force statistics for the U.S. population, including the national and state unemployment rates. The survey provides the most comprehensive data available to help understand the labor force. Detailed questions capture household attachment to the labor force by asking if individuals are available and actively seeking work.
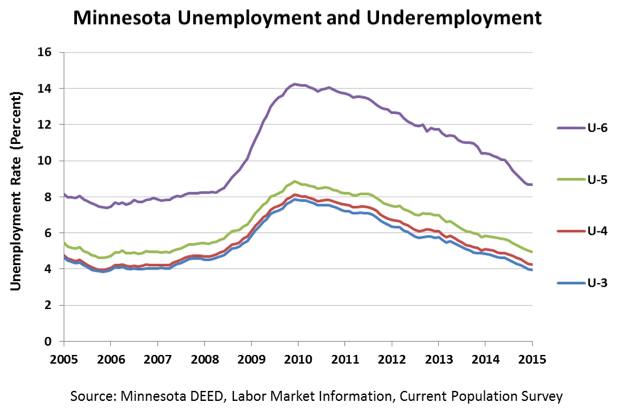
The key to defining unemployment is the connection to the labor force. Those who are discouraged and haven't looked for work or have a marginal attachment and aren't available to work are not counted in the measurements used to produce the official "U-3" unemployment rate. Only those who are actively seeking work are considered unemployed at this level.
Instead, the "U-6" rate includes those discouraged and marginally attached workers, as well as workers who are underemployed by virtue of working only part-time even though they would prefer to work full-time. Minnesota's U-6 rate was 8.7 percent in January 2015, down from 10.4 percent 12 months prior. The number of discouraged and marginally attached workers also slumped across the state in the last year (Figure 2).
In addition to the monthly releases, BLS also provides a detailed annual report summarizing CPS data by state and metropolitan areas for a variety of demographic breakouts, including:
The 2014 preliminary estimates share data by gender, race, ethnicity, and age and show some significant differences in unemployment rates in the state. The unemployment rate gap between whites and Blacks diverged by over 15 percentage points from 2009 to 2011 (Table 1).
| Table 1: Minnesota Unemployment Rates by Race and Ethnicity, 2000-2014 | |||||
|---|---|---|---|---|---|
| Year | Total | White | Black or African American | Asian | Hispanic or Latino |
| 2000 | 3.3% | 3.0% | 7.0% | NA | NA |
| 2001 | 3.7% | 3.5% | 9.4% | NA | NA |
| 2002 | 4.4% | 4.0% | 11.4% | NA | 5.6% |
| 2003 | 5.0% | 4.6% | 10.7% | 7.8% | 5.6% |
| 2004 | 4.8% | 4.3% | 12.9% | 5.0% | 6.4% |
| 2005 | 3.9% | 3.5% | 11.9% | 3.7% | 4.2% |
| 2006 | 4.0% | 3.6% | 10.7% | 5.6% | 4.7% |
| 2007 | 4.6% | 4.1% | 15.8% | 2.8% | 7.1% |
| 2008 | 5.5% | 5.0% | 16.9% | 5.5% | 7.4% |
| 2009 | 7.8% | 7.1% | 22.5% | 7.9% | 15.5% |
| 2010 | 7.3% | 6.4% | 22.0% | 11.7% | 12.3% |
| 2011 | 6.5% | 5.6% | 20.7% | 9.2% | 8.6% |
| 2012 | 5.8% | 5.2% | 13.8% | 5.8% | 8.5% |
| 2013 | 4.9% | 4.3% | 15.0% | 5.7% | 6.8% |
| 2014 preliminary | 4.0% | 3.3% | 11.4% | NA | 7.0% |
| Source: Bureau of Labor Statistics, Geographic Profile of Employment and Unemployment | |||||
Minnesota's unemployment rate has plummeted for all races since then, but the state still had the seventh largest disparity in the U.S. in 2014. The larger gaps between white and Black unemployment rates were primarily in other Midwestern states, led by Wisconsin, Michigan, Iowa, Missouri, and Illinois, as well as Washington.
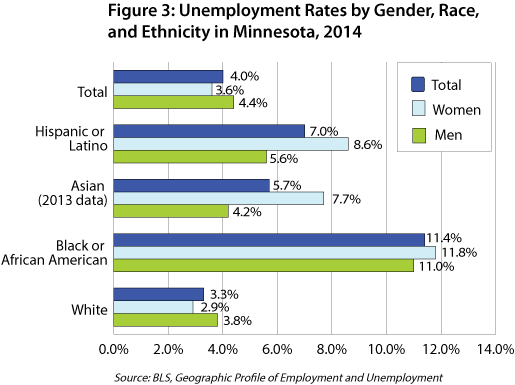
In addition to race, the profile data show unemployment rates by gender and ethnicity. At 3.6 percent, Minnesota had the third lowest unemployment rate for women of any state in 2014, led by a 2.9 percent rate for white women. However, rates were even higher for Black or African American and Hispanic or Latino women than for men, creating even bigger gaps between the race groups for females than overall (Figure 3).
The 2014 Profile also shows disparities in unemployment rates by age groups. Although Minnesota teens had the sixth lowest unemployment rates in the nation, 11.4 percent were still unemployed in 2014. That was significantly lower than the unemployment rate for teens nationwide, which was 19.6 percent in 2014, and was significantly lower than one and two years prior, when Minnesota's unemployment rate for teens was 15.0 and 18.6 percent, respectively (Figure 4).
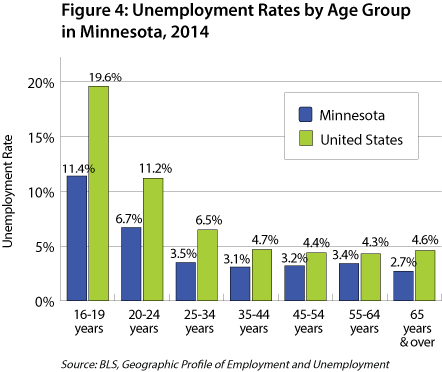
Unemployment rates were 6.7 percent for entry-level workers in the 20-to 24-year-old age group, which was also the fifth lowest in the U.S. In contrast, unemployment rates hovered just above or below 3 percent for most adult age groups in Minnesota, ranging from 3.5 percent for people aged 25 to 34 years to 2.7 percent for people aged 65 years and over.
Unemployment is considered according to the status of individuals at the time they began to look for work. People are divided into different groups based on their reason for unemployment, whether it was a job change or entrance into the labor force. Data were not available in the 2014 preliminary estimates, but are updated through 2013.
In Minnesota well over half (55.9 percent) of the unemployed in 2013 were job losers, comprising persons whose employment ended involuntarily, including those who completed temporary jobs. Eleven percent were job leavers or individuals who quit or otherwise voluntarily terminated their employment. Nearly one in four (24.1 percent) were reentrants to the labor market in 2013, indicating that they were returning to job search activity after some time away from the job market. And 9.0 percent of Minnesota's unemployed were new entrants to the labor market in 2013 or people who have never worked (Figure 5).
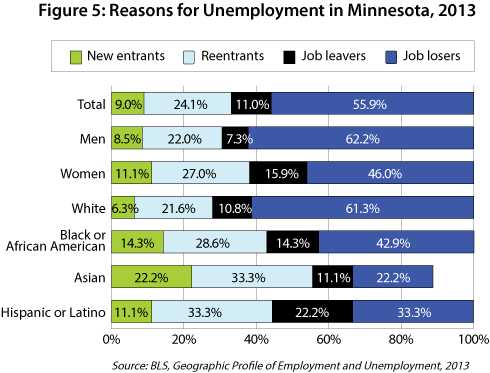
Figure 5 also displays these reasons for unemployment for Minnesotans by race and ethnicity in 2013. Women had a slightly higher rate of new entrants (11.1 percent), job leavers (15.9 percent), and reentrants (27.0 percent) compared to men in Minnesota. Job loss was the dominant reason for unemployment for white and Black or African Americans. Reentry to the labor market was the reason for one in three unemployed Asians and Hispanic or Latino Minnesotans. The percent of new entrants was higher among non-white job seekers and most likely reflects the younger age distribution among different races.
Across the country the average duration of unemployment ranged from 17.6 weeks in North Dakota to 48.0 weeks in Florida in 2013. Minnesota ranked 16th with an average unemployment duration of 29.1 weeks.
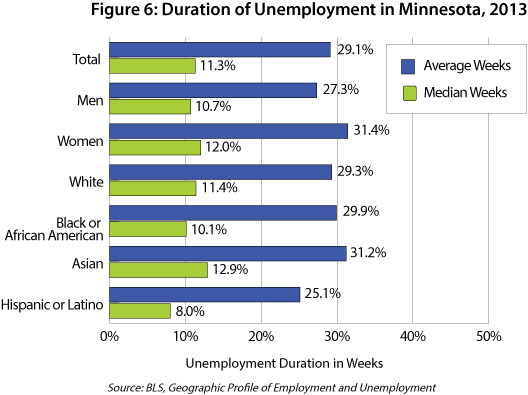
Figure 6 provides the duration of unemployment in Minnesota in 2013 in average and median weeks for various characteristics of the unemployed. While the state's average unemployment was 29.1 weeks, the median number of weeks of unemployment was 11.3. The difference in the median and average weeks of unemployment suggests that many people have been unemployed for long periods of time. In fact, nearly 39,000 Minnesotans were unemployed for 27 weeks or more in 2013, accounting for just over one in four (26.9 percent) unemployed workers.
Minnesota men had slightly shorter (27.3 weeks) average employment duration than women (31.4 weeks). Average unemployment duration was similar among race and ethnic groups. Asian workers had the longest mean unemployment duration at 31.2 weeks, while Hispanics or Latinos had the shortest mean duration at 25.1 weeks. This shows remarkable improvement in average unemployment duration from 2011 and 2012.
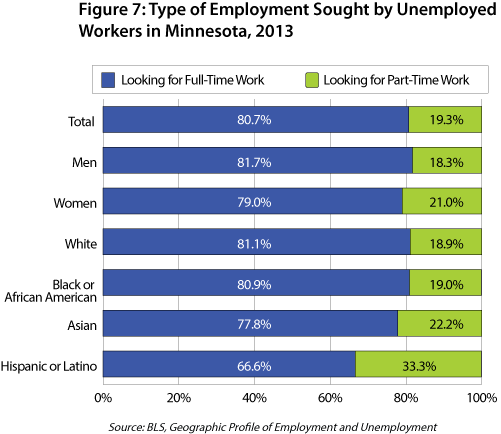
One in five unemployed workers in Minnesota (19.3 percent) was seeking part-time work. Of those 28,000 job seekers looking for part-time employment, nearly half were individuals between 16 and 19 years old, which reflects the schedule restrictions and educational attachment of teens. Unfortunately, this is the only age category for which this data is available.
Figure 7 explores the percentages of unemployed individuals seeking part-time or full-time work by gender, race, and ethnicity. There was very little difference between the type of employment sought among the White, African American, and Asian unemployed population. In each case about one-fifth of job seekers were looking for part-time work. However, about one in three unemployed Hispanic or Latino Minnesotans was seeking part-time employment in 2013. By gender, women were slightly more likely than men to be seeking part-time work, but in both cases, about 20 percent wanted part-time work.
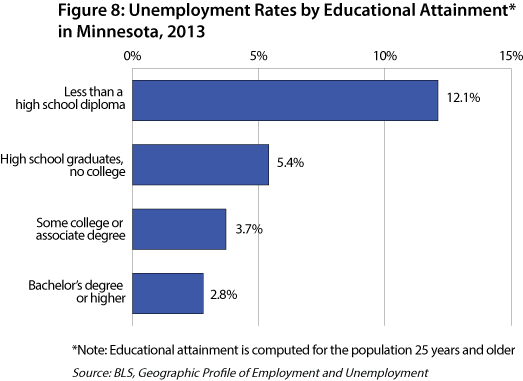
Finally, the CPS profile data display the disparity in unemployment rates by educational attainment for the population aged 25 years and over in Minnesota in 2013. Trends have long demonstrated that the higher the level of education, the lower the unemployment rate. In 2013 adults with no high school diploma had an unemployment rate (12.1 percent) four times as high as adults with a bachelor's degree or higher (2.8 percent) (Figure 8). However, it is important to note that unemployment rates dropped for all educational attainment levels between 2012 and 2013.
Overall, Minnesota's economy and labor market continue to see steady improvement. Monthly and annual updates from the CPS show that unemployment rates dropped across the board between 2012 and 2013 and again into 2014, but different groups still face different challenges while seeking work.
Although Minnesota's unemployment rates were relatively low in comparison to other states, rates remained relatively high for teenagers and young adults, non-whites, and people with less than a high school diploma. The number of discouraged and marginally attached workers declined, as did the number of people working part-time who would prefer to be working full-time.
Thankfully, unemployment duration also sank for many groups, including Asians and African Americans in Minnesota. Women had higher average unemployment duration than men, but lower unemployment rates overall. Finally, education remains highly correlated with unemployment, as Minnesota adult residents with no high school diploma continued to struggle with the highest unemployment rates in 2013, while workers with bachelor's degrees or higher found it easier to find work.
If the economy and labor market continue to strengthen as rapidly in the next couple of years as in the past two years, unemployment rates and disparities should continue to shrink across the state. CPS data will continue to provide the details on the improvements and remaining challenges.
1Labor force data for American Indians are not included in the "Geographic Profile of Employment and Unemployment" report.
2Persons of Hispanic or Latino ethnicity may be of any race.
3Limited data are available for age groups.