by Dave Senf
September 2014
Note: All data except for Minnesota's PMI have been seasonally adjusted. See the feature article in the Minnesota Employment Review, May 2010, for more information on the Minnesota Index.
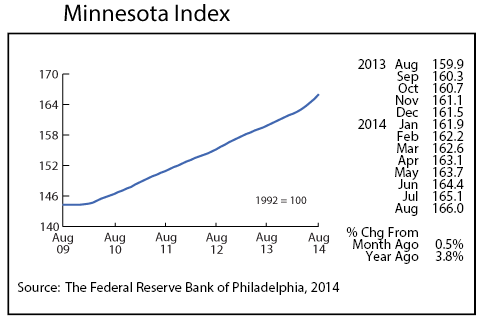
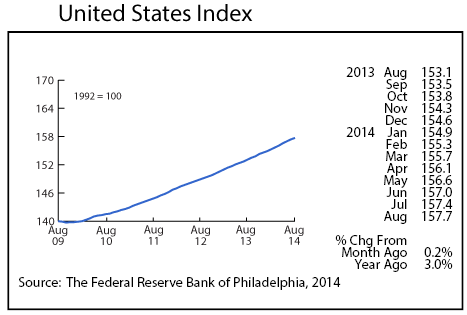
The Minnesota Index increased 0.5 percent for the second straight month in August, signaling that Minnesota's economy has been gaining momentum over the last few months. All four components of the index moved positively with job growth accelerating, unemployment decreasing, average weekly manufacturing hours climbing, and real wage and salary disbursements advancing. The pace of economic growth has doubled since earlier in the year with the average monthly increase in the index jumping from 0.2 percent during the first three months to 0.4 percent over the last five months.
Minnesota's index in August was up 3.8 percent from a year ago while the U.S. index was 3.0 percent higher than a year ago. Minnesota's index has been increasing faster than the U.S. index since May. Both indices are monthly proxies for the economic growth that are subject to significant revisions as preliminary data get revised.
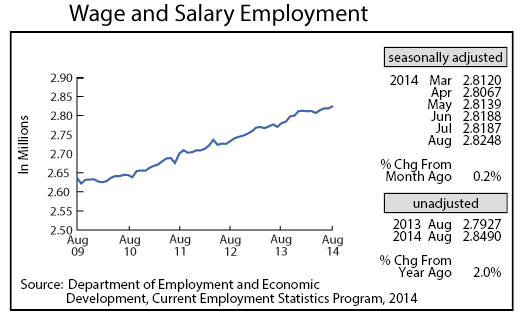
Adjusted Wage and Salary Employment grew by 6,100 jobs in August, the second best monthly gain this year behind May's 7,200 increase. Almost all of the job growth was in the private sector with the goods producing sector leading the way. Construction accounted for a large share of the job bump adding 2,500 workers. That was the highest monthly construction gain since April 2010. Hiring was broad based as nine of the 11 super sectors expanded payroll numbers. Only Educational and Health Services and Trade, Transportation, and Utilities reduced their workforce in August.
Minnesota job growth over the year, using unadjusted job numbers, slipped to 2.0 percent but remained above the U.S. rate which was 1.9 percent higher than a year ago. Minnesota's over-the-year job growth rate has average 1.8 percent through the first eight months of the year which is up a tad from last year's 1.7 percent annual average.
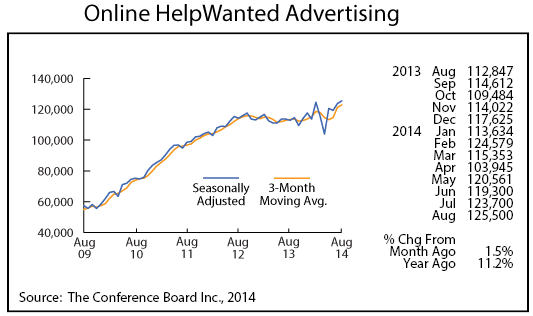
Minnesota's adjusted online Help-Wanted Ads surged to a record high in August, spiking to 125,500. Monthly online job advertising has been tracked by the Conference Board, Inc. since 2005. National online help-wanted ads also reached a record high in August. Minnesota's share of online job ads dipped slightly to 2.4 percent which is still higher than the state's 2.0 percent of wage and salary employment. The record level of online job ads in Minnesota signals that labor demand in Minnesota remains healthy.
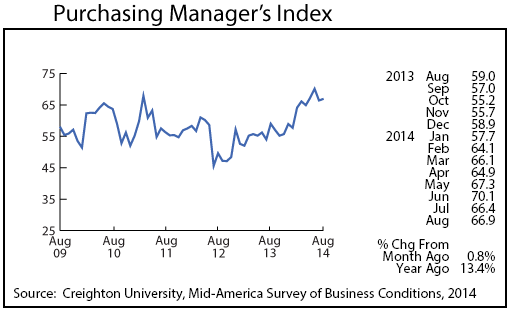
Minnesota's Purchasing Managers' Index (PMI) ticked up slightly in August to 66.9. The index is produced by economists at Creighton University as part of their nine-state Mid-America Business Conditions Index. Minnesota's PMI has been robust since February, reflecting Minnesota's expanding manufacturing activity. So far in 2014 the index has averaged 65.4 which is well above the 2004 record annual average of 62.5. PMI data for Minnesota is available back to 1995.
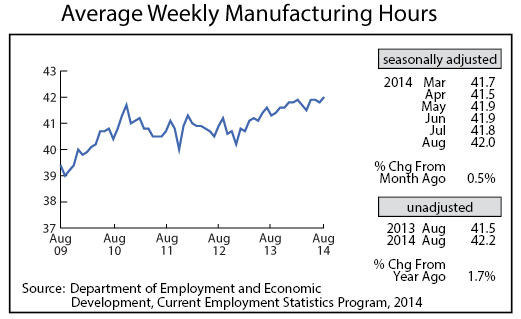
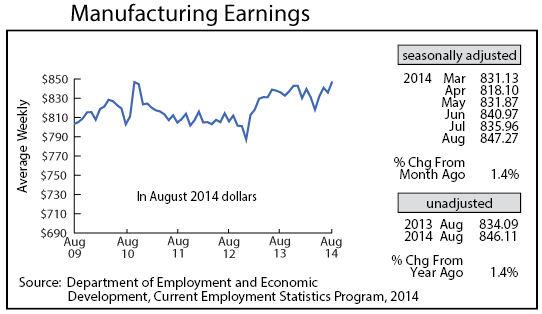
Adjusted Manufacturing Hours advanced to 42.0 hours in August, making last month just the fifth month since 1970 with average hours worked at or above 42 hours. The longer workweek is consistent with the solid PMI reading. Manufacturing hours in 2014 are on pace through August to break the 2004 record of 41.6 hours per week. Increasing Manufacturing Earnings in August reflect the overtime pay as earnings spiked to the second highest real average weekly paycheck on record. The only paycheck in the 34-year series fatter than August's $847.27 was the $851.10 paycheck in May 2006.
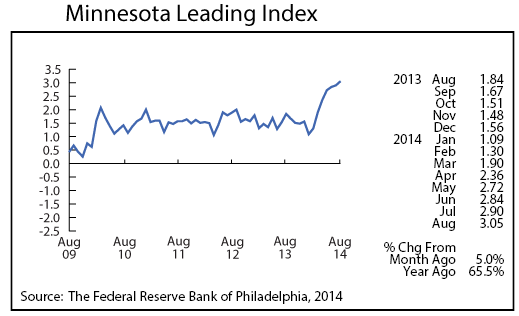
The Minnesota Leading Index offered more evidence supporting the view that Minnesota's economy has picked up speed over the last few months as August's reading of 3.05 was the highest reading since December 1986. The index, which was designed to predict Minnesota's GDP growth six months down the road, is predicting that Minnesota's GDP will grow by an optimistic 3 percent over the next six months. The index gets revised as updated data arrive so it is likely that the index will be revised downward.
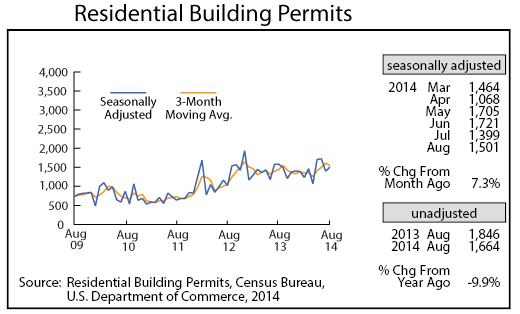
After plunging in July, adjusted Residential Building Permits rebounded partially, increasing 7.3 percent to 1,501 units. Minnesota's home building rebound, just like the national housing picture, has been disappointing for most of the year with annual average permits likely to end up just slightly higher this year than last year.
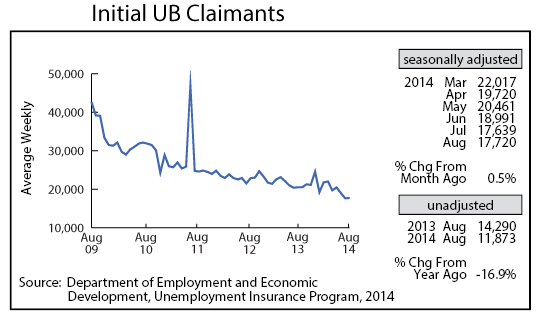
Adjusted Initial Claims for Unemployment Benefits (UB) inched up 0.5 percent, but the long-term trend of waning new claims for jobless benefits points toward continued improvement in Minnesota's labor market.