by Dave Senf
March 2016
Note: All data except for Minnesota’s PMI have been seasonally adjusted. See the feature article in the Minnesota Employment Review, May 2010, for more information on the Minnesota Index.
The Minnesota Index, U.S. Index, and Minnesota Leading Index are generated by the Philadelphia Federal Reserve Bank. At the beginning of each year the indices are delayed by two months as revised component numbers are used to recalibrate the indices. January’s indices are scheduled for release on April 6.
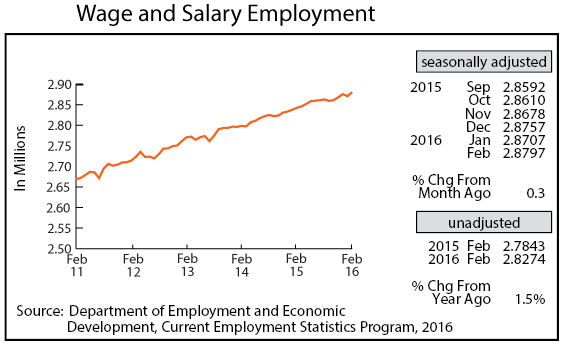
Adjusted Wage and Salary Employment pulled a U-turn in February as 9,000 jobs were added after 5,000 were lost in January. All job growth was in the private sector which added 10,000 jobs, the highest private sector monthly gain in over three years. Half of the increase in private sector payrolls was in Educational and Health Services. Hiring was also robust in Trade, Transportation, and Utilities, Construction, and Financial Activities. Job cutbacks were over 1,000 each in Government, Professional and Business Services, and Leisure and Hospitality.
Minnesota’s unadjusted over-the-year job growth ticked up to 1.5 percent in February, the highest level since last July. U.S. job growth was 1.9 percent for the second straight month, making last month the 19th consecutive month Minnesota job growth has lagged behind national job growth.
Minnesota’s unemployment rate on an annual basis was 3.7 percent last year, the lowest annual average in 15 years and tied with 1996 for fifth lowest since 1976 when the current method of estimating Minnesota’s unemployment rate was established. The years with lower unemployment rates were from 1997 to 2000: 3.3 percent in 1997, 2.7 percent in 1998, 2.8 percent in 1999, and 3.2 percent in 2000.
The Minnesota unemployment rate continued to run well below the U.S. rate last year even though the U.S rate dropped to its lowest rate since 2007, 5.3 percent. The gap between Minnesota and the national unemployment rate was above 2 percent between 2010 and 2014 but fell to 1.6 percent in 2015. The 1.6 percent gap is very close to the 1.5 percent historical average. Minnesota’s unemployment rate has averaged 4.9 percent since 1976 while the U.S average rate over the 40-year period is 6.4 percent.
Minnesota’s unemployment rate has been cut in half over the last six years after peaking in 2009 at 7.8 percent. The decline has been caused by moderate job growth combined with slow labor force growth. Labor force growth, however, accelerated last year, increasing 0.9 percent after having average 0.4 percent between 2002 and 2014. Labor force participation rates increased in 2015 for the first time in 15 years last year as the strong hiring demand drew workers back into the labor force.
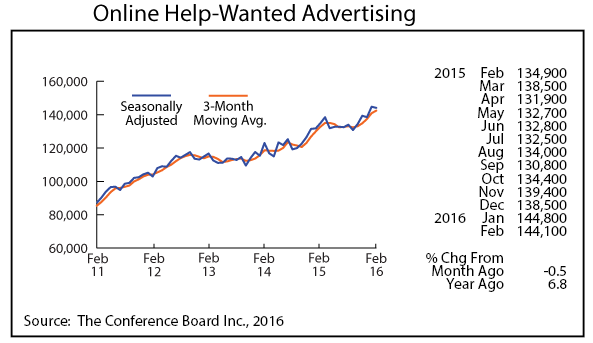
Online Help-Wanted Ads ticked down slightly in February from January’s record high to 144,100. February’s decline was 0.5 percent in Minnesota while nationally online job advertising slipped by 2.9 percent. Minnesota’s share of online help-wanted advertising increased to its highest level, 2.7 percent, in February.
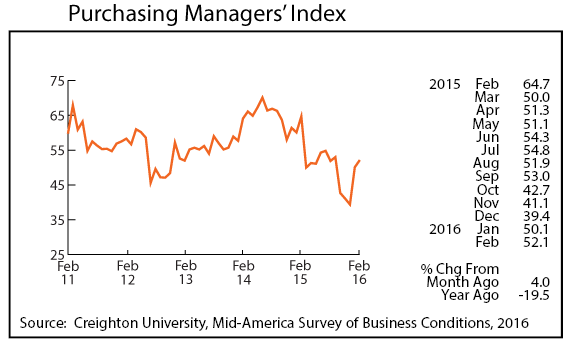
Minnesota’s Purchasing Managers’ Index (PMI) continued to rebound, increasing for the second straight month to 52.1 in February. Any reading above 50 indicates expanding economic activity over the next six months.
The Mid-America Index, a nine-state region ranging from Arkansas to Minnesota, was 50.5 last month while the U.S. index was 49.5.
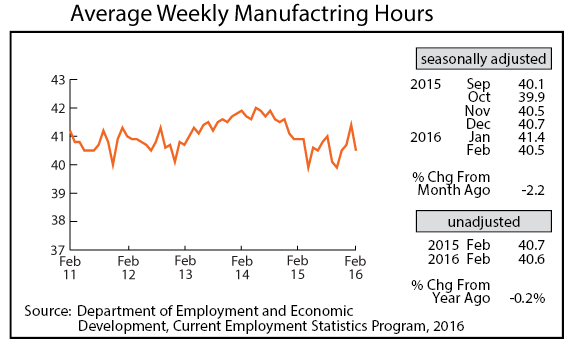
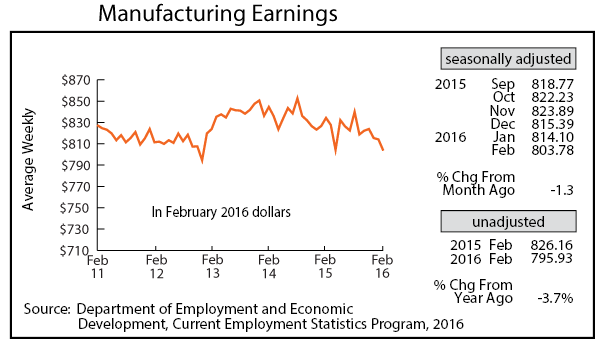
Adjusted Manufacturing Hours, after increasing for three consecutive months, tanked in February, dropping off to 40.5 hours. Manufacturing activity seems still to be dealing with the headwinds of a strong U.S. dollar and a slow-growing global economy. Average weekly Manufacturing Earnings dipped for the third month in a row, tailing off to $803.78, the smallest factory paycheck in over three years. February’s earnings were 6.9 percent smaller in real terms than the all-time $857.77 average weekly paycheck earned in May 2006.
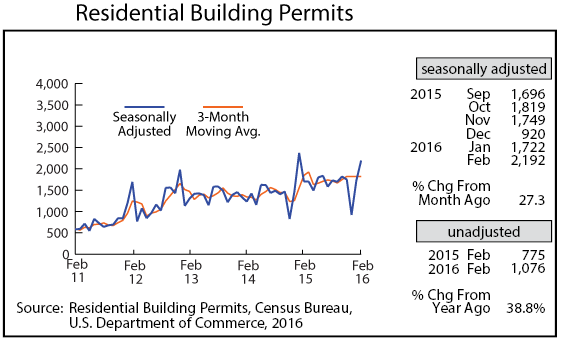
Adjusted Residential Building Permits jumped again in February, moving to 2,192. That is the highest monthly total since last January. After getting off to a slow start in January, permit numbers through the first two months of 2016 are roughly the same as last year.
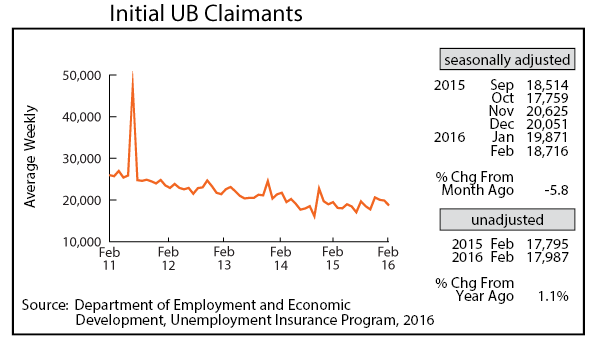
Adjusted Initial Claims for Unemployment Benefits (UB) inched down for the third straight month, declining to 18,716. February’s level is slightly below the 18,807 monthly average recorded last year. The low level of initial claims points towards another year of job growth hovering around 1.5 percent which should help spur more workers to join the labor force and keep the state’s labor force growth expanding at a clip similar to last year.
