by Dave Senf
February 2018
Note: All data except for Minnesota’s PMI have been seasonally adjusted. See the feature article in the Minnesota Employment Review, May 2010, for more information on the Minnesota Index.
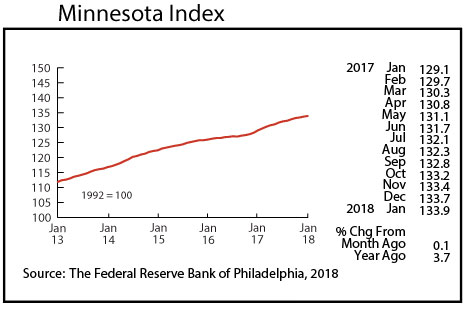
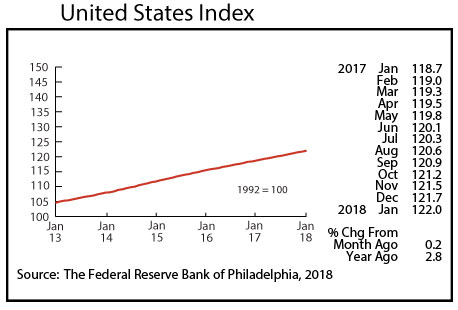
The recently revised Minnesota Index, after having increased 0.2 percent in each of the last two months of 2017, increased 0.1 percent in January. The U.S. index advanced 0.2 percent. Minnesota’s index is up 3.7 percent over the year compared to 2.8 percent for the nation.
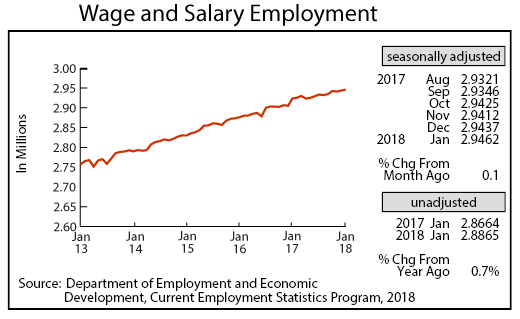
Minnesota’s adjusted Wage and Salary Employment rose for the second month in a row increasing by 2,500 jobs. December’s gain was revised from 8,900 to 2,500. All job growth in January was in the public sector which added 2,700 positions. State government payroll expansion accounted for most of the government job growth. Private sector employment decreased by 200 jobs. While six supersectors added workers only Leisure and Hospitality added more than 1,000 positions. Job loss topped 1,000 in Educational and Health Services and Financial Activities.
Minnesota’s unadjusted over-the-year job growth dropped to 0.7 percent, the lowest rate since October 2010. Over the year U.S. job growth in January was 1.5 percent. The 0.7 to 1.5 percent monthly gap was the largest for the state since June 2016. Minnesota’s annual average job growth for 2017 was revised significantly downwards during annual benchmarking to 1.3 percent, the same rate as in 2016. Minnesota added 38,300 jobs in 2016 and 38,200 in 2017. The December to December growth for 2016 and 2017 was 29,700 and 30,600, respectively. Over-the- year job growth slowed during last six months of 2017 tailing off from a monthly average of 1.6 percent during the first half year to 1.1 percent during the second half.
Minnesota’s annual average job growth lagged national job growth for the fourth straight year but by less than in previous years. Minnesota annual average job growth was 1.4, 1.6, 1.,3 and 1.3 percent 2014, 2015, 2016, and 2017 compared to 1.9, 2.1, 1.8, and 1.6 percent for the U.S. Minnesota trailed U.S. job growth by 0.3 percentage points in 2017 down from 0.5 percentage points in 2016 as Minnesota’s job growth rate was the same in 2016 and 2017, 1.3 percent, while U.S. job growth slipped from 1.8 percent to 1.6 percent in 2017.
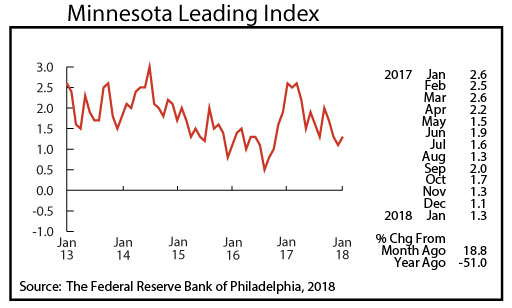
The recently revised Minnesota Leading Index bounced back a tad in January, advancing to 1.3 in January from December’s 1.1 reading. The index reached 2.0 last September before dropping for three months in a row. The 1.3 reading suggest that Minnesota’s economy will expand by 1.3 percent over the next six months.
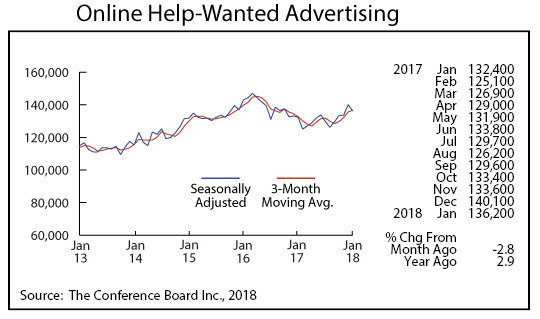
Online Help-Wanted Ads fell off in January sliding to 136,000. Online job postings declined 2.8 percent in Minnesota while nationwide postings remained flat from December. Minnesota’s share of U.S. online help-wanted ads inched down to 2.8 percent from 2.9 percent. Minnesota’s wage and salary employment in January continued to represent 2.0 percent of U.S. wage and salary employment. Minnesota’s share of nationwide online help-wanted ads continues to be disproportionately higher than its share of national employment.
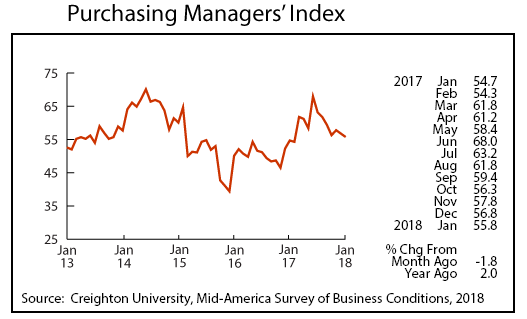
Minnesota’s Purchasing Managers’ Index (PMI) dipped for the second month in a row to 55.8, the lowest reading since last February. The index peaked last June and has been tailing off since. Minnesota manufacturers, after gaining momentum during the first half of 2017, have apparently shifted down a gear or two during the last few months. The corresponding national index increased to 59.1 while the Mid-American index fell to 57.3.
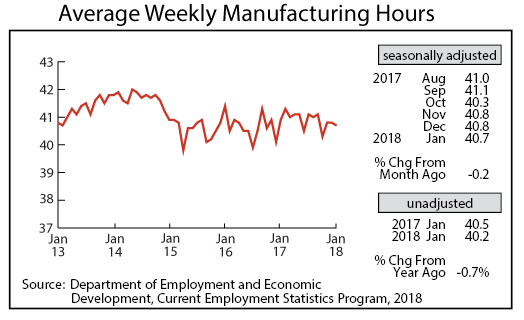
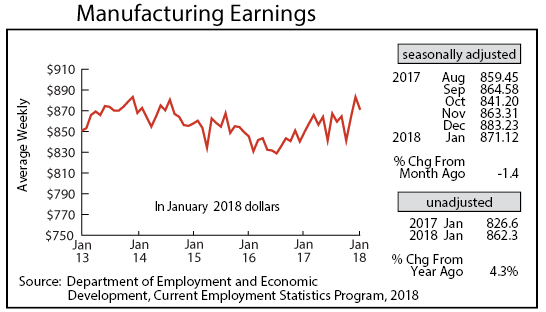
Adjusted average weekly Manufacturing Hours crept down to 40.7 in December. The factory workweek, after annual revisions, averaged 40.9 hours for 2017 which was up slightly from 40.7 in 2016. Average weekly Manufacturing Earnings retreated in December to $871.12. Seasonally and inflation adjusted factory earnings were up 2.6 percent from last year. Revised 2017 annual average manufacturing earnings were up 2.5 percent in real terms from 2016.
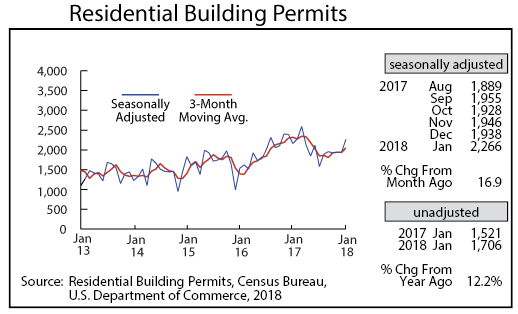
Adjusted Residential Building Permits, after having been flat over the last half of 2017, spiked upwards in January to 2,266. That’s the highest level since last March. January’s spike was from a large bump in building permits for apartments. Construction employment grew by 3.0 percent in 2017 which was an improvement over the 0.9 percent in 2016. The 119,600 average annual construction employment in 2017 was roughly 7.5 percent short of the all-time high of 129,400 during the housing boom days in 2005.
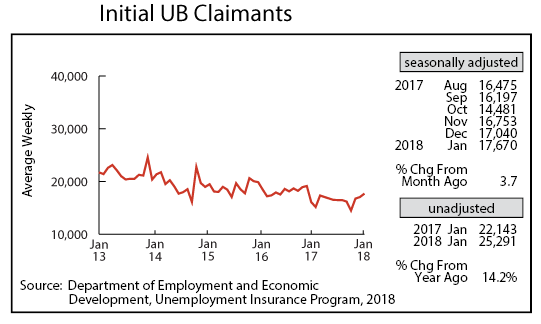
Adjusted Initial Claims for Unemployment Benefits (UB) rose for the third consecutive month in January, climbing to 17,670, the highest total since December 2016. Unadjusted initial claims were up 14.2 percent from last January, the first over-the-year increase since August 2016. Despite the moderate uptick in initial claims over the last few months the level of initial claims, a proxy for layoff rate, remains near historical lows. January’s seasonally adjusted unemployment rate remained at 3.3 percent for the fifth straight month. Unemployment in the state is at a 17-year low.