by Bettsy Hjelseth
August 2019
This subsector is the first of the Public Administration industry sector. It includes government executives, legislative bodies, public finance, and general government support. Executive includes the offices of the president, state governors, city mayors, and executive advisory commissions. Legislative bodies include Congress, state legislatures, and advisory and study legislative commissions. Public finance includes government entities involved in public finance, taxation, and monetary policy. General government support includes those offices where the executive and legislative are combined, American Indian and Alaska Native Tribal Governments, and government entities that provide general support, such as personnel services and election boards.
| Table 1. Executive, Legislative, and Other General Government Support Employment in Minnesota, 2018 | ||||||
|---|---|---|---|---|---|---|
| Industry | Number of Firms | Number of Jobs | Federal Government Share | State Government Share | Local Government Share | Average Annual Wage |
| Total Government Employment | 6,856 | 384,614 | 8.3% | 21.2% | 70.5% | $55,120 |
| Public Administration | 3,382 | 134,418 | 8.3% | 23.3% | 68.3% | $58,136 |
| Exec, Legislative, and Other Gov't Support | 1,473 | 73,876 | 1.5% | 7.9% | 90.6% | $51,636 |
| Source: DEED Quarterly Census of Employment and Wages (QCEW) | ||||||
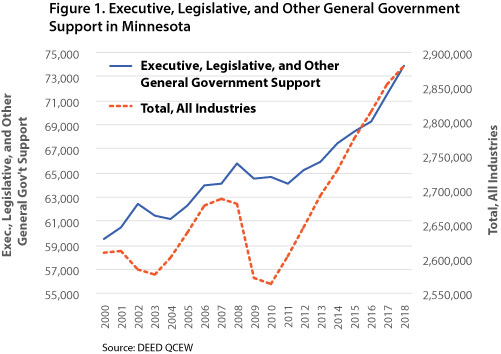
Local government holds the largest share of employment by far in the Executive, Legislative, and Other General Government Support subsector at 90.6 percent of total government share. In comparison, total government employment at the local level holds 70.5 percent of the total share. The average annual wage for workers in this subsector is $51,636 per year, which is $20,736 more than the cost of living for a single person in Minnesota between the ages of 19 and 50 with no children. Since 2000, Minnesota employment in Executive, Legislative, and Other General Support has had a 24.1 percent increase, compared to employment in all industries which had a 10.4 percent increase. The number of establishments in 2000 in Executive, Legislative, and Other General Government Support was 1,438, which increased slightly to 1,473 establishments in 2018. This represents a 2.4 percent increase. In comparison, the number of establishments in all industries increased from 156,083 to 175,424, a 12.4 percent increase, from 2000 to 2018.

Looking to transform metal into an end product using forging, stamping, bending, forming, machining, welding, or assembling? Fabricated Metal Production Manufacturing is the industry in which you'll work. A company can do one of these processes or a combination. This industry does not create machinery, computers, electronics, and metal furniture, or treat metals and metal formed products fabricated elsewhere.
| Table 1. Fabricated Metal Production Manufacturing Top Employing Occupations | ||||||
|---|---|---|---|---|---|---|
| Occupation | Employment | Median Wage | 2016-2026 Employment Change | |||
| Numeric | Percent | |||||
| Machinists | 12,870 | $24.35 | 711 | 5.5% | ||
| Welders, Cutters, Solderers, and Brazers | 9,410 | $21.66 | 655 | 6.8% | ||
| Team and All Other Assemblers | 32,050 | $16.38 | N/A | N/A | ||
| First-Line Supervisors of Production and Operating Workers | 11,780 | $30.58 | 357 | 3.0% | ||
| Cutting, Punching and Press Machine Setters, Operators, and Tenders, Metal and Plastic | 5,610 | $21.10 | -340 | -4.0% | ||
| Computer-Controlled Machine Tool Operators, Metal and Plastic | 3,310 | $21.68 | 193 | 4.3% | ||
| Inspectors, Testers, Sorters, Samplers, and Weighers | 10,090 | $20.16 | -1,056 | -11.4% | ||
| Helpers – Production Workers | 8,400 | $14.59 | 1,593 | 14.8% | ||
| General and Operations Managers | 46,440 | $45.84 | 3,220 | 7.4% | ||
| Structural Metal Fabricators and Fitters | 800 | $20.57 | -140 | -13.7% | ||
| Source: BLS Industry-Occupation Matrix, DEED Occupational Employment Statistics (OES), DEED Employment Outlook | ||||||
Other than management positions, machinists are the highest paid top employing occupation in Metal Production Manufacturing. These employees make a median wage of $24.35 an hour which is $9.49 more than the cost of living for a single person in Minnesota between the ages of 19 and 50 with no children. Machinist employment in this subsector is expected to grow by 5.5 percent or 711 additional jobs from 2016 to 2026.
Employees in Fabricated Metal Production Manufacturing working in the Metro Area receive the highest annual average wage of $65,156, while those working in Northwest Minnesota receive the lowest annual average wage at $49,348 per year. Since 2010, Minnesota has seen an increase of 18.5 percent for jobs in Fabricated Metal Production Manufacturing. Of the 6,819 added jobs, 50.9 percent were in the Metro Area (3,471 jobs). Central Minnesota added 26.6 percent (1,811) of the total.
Need to stop by a grocery store to buy some something to cook for dinner? Companies that use freezers and refrigerators to hold food and beverage merchandise fall under the Food and Beverage Stores subsector. Regulating authorities keep these companies accountable so that the merchandise is stored properly and kept sanitary. Convenience stores, meat markets, liquor stores, and baked goods stores are just a few of the many types of establishments that belong in this industry.
| Table 1. Food and Beverage Stores - Top Employing Occupations | ||||||
|---|---|---|---|---|---|---|
| Occupation | Employment | Median Wage | 2016-2026 Employment Change | |||
| Numeric | Percent | |||||
| Cashiers | 65,840 | $11.72 | -260 | -.4% | ||
| Stock Clerk and Order Fillers | 35,190 | $13.80 | 1,153 | 3.4% | ||
| Food Preparation Workers | 8,670 | $12.98 | 371 | 3.9% | ||
| First-Line Supervisors of Retail Sales Workers | 20,360 | $20.02 | 650 | 2.6% | ||
| Retail Salespersons | 87,430 | $12.38 | -852 | -1.0% | ||
| Packers and Packagers, Hand | 10,250 | $13.09 | -60 | -.5% | ||
| Combined Food Preparation and Serving Workers, Including Fast Food | 66,060 | $11.57 | 7,983 | 12.0% | ||
| Butchers and Meat Cutters | 2,050 | $17.65 | 168 | 6.8% | ||
| Customer Service Representatives | 58,710 | $18.55 | 396 | .7% | ||
| Bakers | 2,510 | $14.44 | 137 | 4.6% | ||
| Source: BLS Industry-Occupation Matrix, DEED Occupational Employment Statistics (OES), DEED Employment Outlook | ||||||
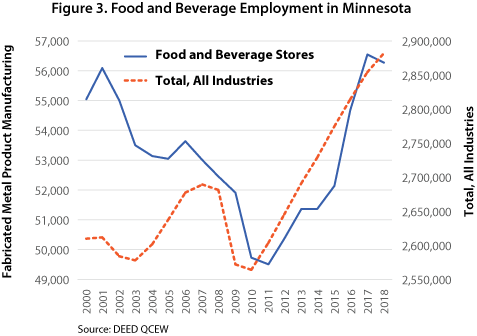
In 2000 the Food and Beverages Stores subsector had 55,063 statewide jobs. In 2018 it slightly increased to 56,291 statewide jobs, a 2.2 percent increase. The subsector saw its lowest employment numbers in 2011 at 49,508 after which it started to recover from the Great Recession. The 2016 to 2026 employment change projections expect combined food preparation and serving workers, including fast food to see an increase of 7,983 jobs which is a 12.0 percent increase. The median wage for these employees is $11.57 per hour which is $3.29 hour less than the cost of living in Minnesota for a single person between the ages of 19 and 50 with no children. Cashiers, retail salespersons, and hand packers and packagers are all projected to lose a small percentage of jobs by 2026 from an increase in automation. Most of the top employing jobs in this subsector require no formal education.

The Food Manufacturing subsector transforms livestock and agricultural products into food. The raw materials used are animals or fruits and vegetables. The products made are sold to wholesalers or retailers where consumers then purchase them. Retail bakeries as well as establishments that produce candy products that are not immediately consumed also belong in this subsector. This industry includes everything from animal food and dairy product manufacturing to seafood product preparation and packaging.
| Table 1. Food Manufacturing - Top Employing Occupations | ||||||
|---|---|---|---|---|---|---|
| Occupation | Employment | Median Wage | 2016-2026 Employment Change | |||
| Numeric | Percent | |||||
| Packaging and Filling Machine Operators and Tenders | 10,320 | $17.02 | 159 | 1.5% | ||
| Meat, Poultry, and Fish Cutters and Trimmers | 5,060 | $15.42 | 89 | 2% | ||
| Food Batchmakers | 4,680 | $16.73 | 112 | 2.4% | ||
| Slaughterers and Meat Packers | 4,140 | $15.69 | 106 | 1.9% | ||
| Packers and Packagers, Hand | 10,250 | $13.09 | -60 | -0.5% | ||
| Laborers and Freight, Stock, and Material Movers, Hand | 43,790 | $16.56 | 2,134 | 5.5% | ||
| Helpers-Production Workers | 8,400 | $14.60 | 1,593 | 14.8% | ||
| Bakers | 2,510 | $14.44 | 137 | 4.6% | ||
| First-Line Supervisors of Production and Operating Workers | 11,780 | $30.58 | 357 | 3.0% | ||
| Industrial Truck and Tractor Operators | 6,450 | $19.94 | 766 | 7.5% | ||
| Sources: BLS Industry-Occupation Matrix, DEED Occupational Employment Statistics (OES), DEED Employment Outlook | ||||||
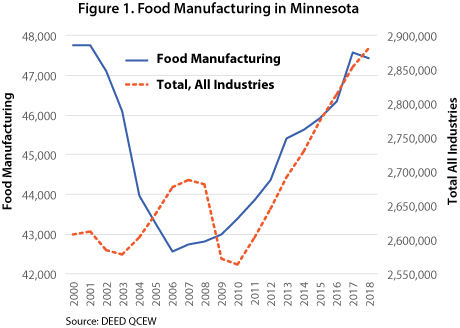
The lowest paid but top employing occupation in the Food Manufacturing industry is packers and packagers, hand. There are a total of 10,250 in the state, and these employees make a median wage of $13.09 which is $1.77 less than the cost of living for a single person in Minnesota between the ages of 19 and 50 with no children. This occupation's employment is projected to decrease by 0.5 percent by 2026, making it the only top employing occupation in this subsector projected to lose employment by 2026. All areas of the state except for Northeast Minnesota have a large concentration of Food Manufacturing employment. Southwest Minnesota, Southeast Minnesota, and the Metro Area hold the largest share of these employees, a total of 68.7 percent of total statewide employment. All areas except for Northeast Minnesota saw an increase in Food Manufacturing employment from 2010 to 2018.
