
by Alessia Leibert
September 2023
Among Minnesota workers laid off during the initial months of the Pandemic Recession, how many were able to return to their pre-pandemic wages by the end of 2022? And did claimants of color benefit from the economic recovery?
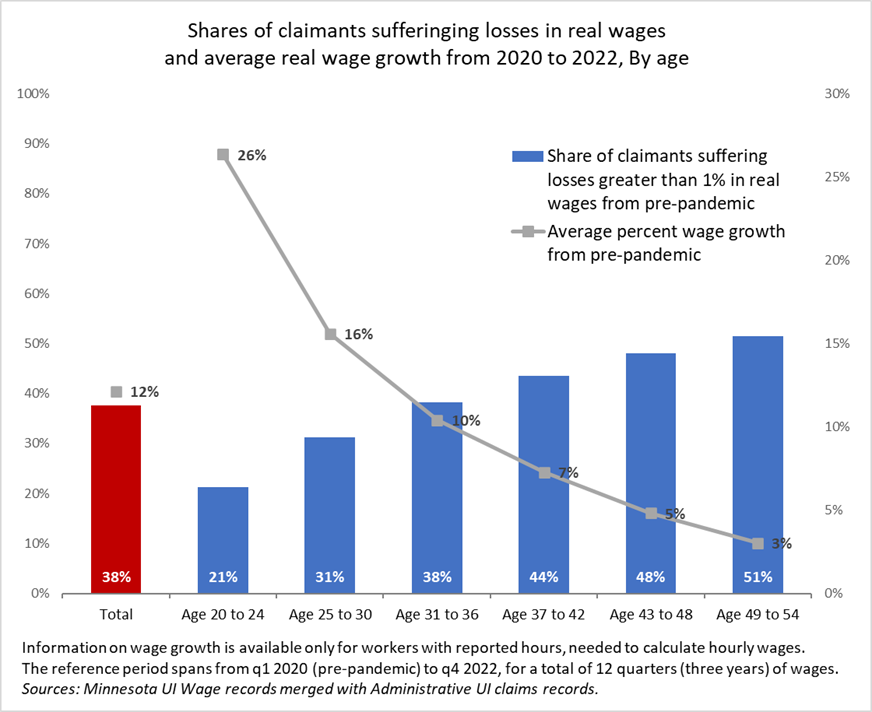
This study answers these questions by analyzing the earnings of 241,736 people in the Twin Cities Metro who requested UI benefits1 in the initial months of the Pandemic Recession. Given the high rates of inflation post-recession, real earnings (inflation-adjusted) were eroded for workers whose salaries did not keep up with inflation, and these tended to be older workers. Overall, 38% of claimants were unable to return to pre-pandemic wages, suffering wage losses greater than 1% (Figure 1). The share of negatively affected individuals increases with age, penalizing older workers the most.
Figure 1
Claimants with lower educational attainment (who are also typically younger) benefited from the extremely tight labor market in those low-wage, low-skill sectors that had to remain closed for longer and could lure workers back to work with high wage offers. As shown in Figure 2, claimants with high school or less posted higher average wage growth than claimants with a bachelor's or higher credential. The most penalized were claimants with a master's degree or higher: 53% of them suffered wage losses greater than 1% of their pre-pandemic wages, not because they switched to lower-paying jobs but because their employer did not adjust their wages enough to offset inflation.
Figure 2
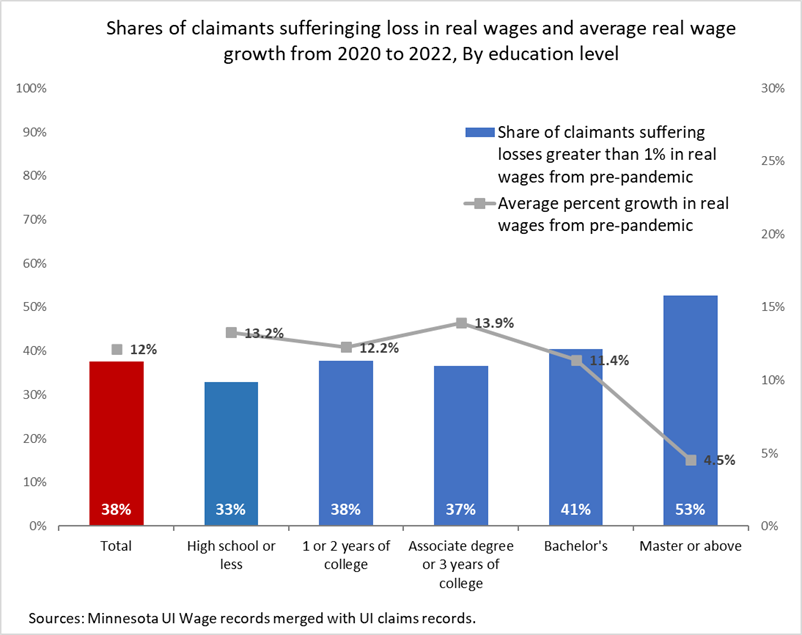
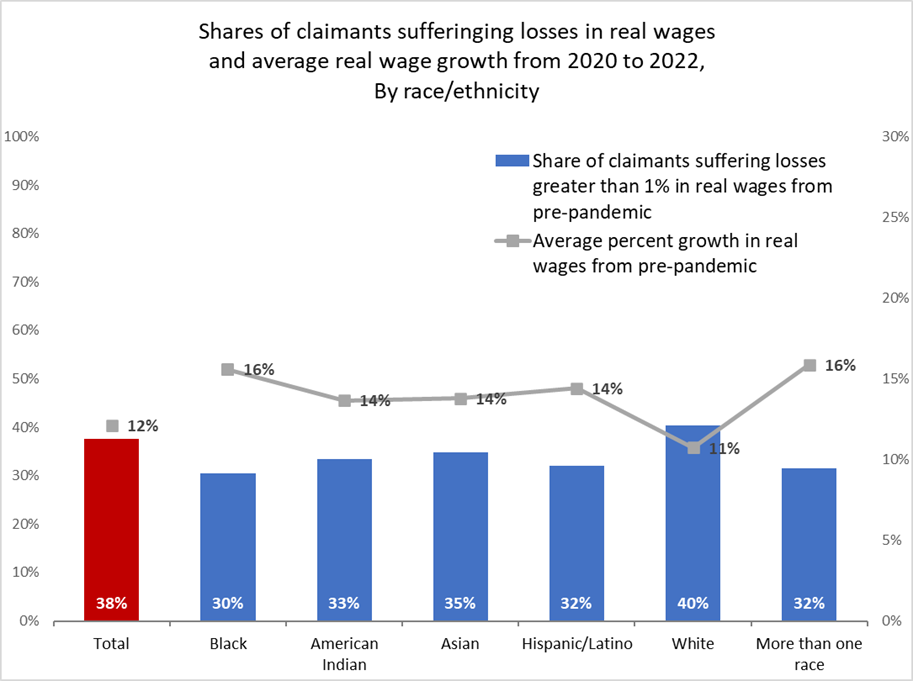
Figure 3 wraps up this introduction by showing strong wage growth among claimants of color. Black claimants and those who identified with more than one race benefited the most, posting an average wage growth of over 16% versus 11% among white claimants.
Figure 3
Low-wage workers also benefited. According to this recent report, income for workers in the bottom 25% grew much faster than others even after accounting for inflation.
Did higher wage growth for the segments of the workforce who need it the most fix wage inequalities by race, ethnicity and education? This does not seem to be the case. One and a half years of strong wage growth were not enough to offset the large earnings inequalities that pre-dated the pandemic. The next section breaks down earnings by race/ethnicity, age, and education level to examine pre- to post-pandemic wage inequalities. Figure 4 plots median hourly wages from 1st quarter 2020 to 4th quarter 2022, for a total of 12 quarters - or three years - of data. To simplify the display, the graph shows only the four largest race/ethnic groups and ages 20 to 42.
Figure 4
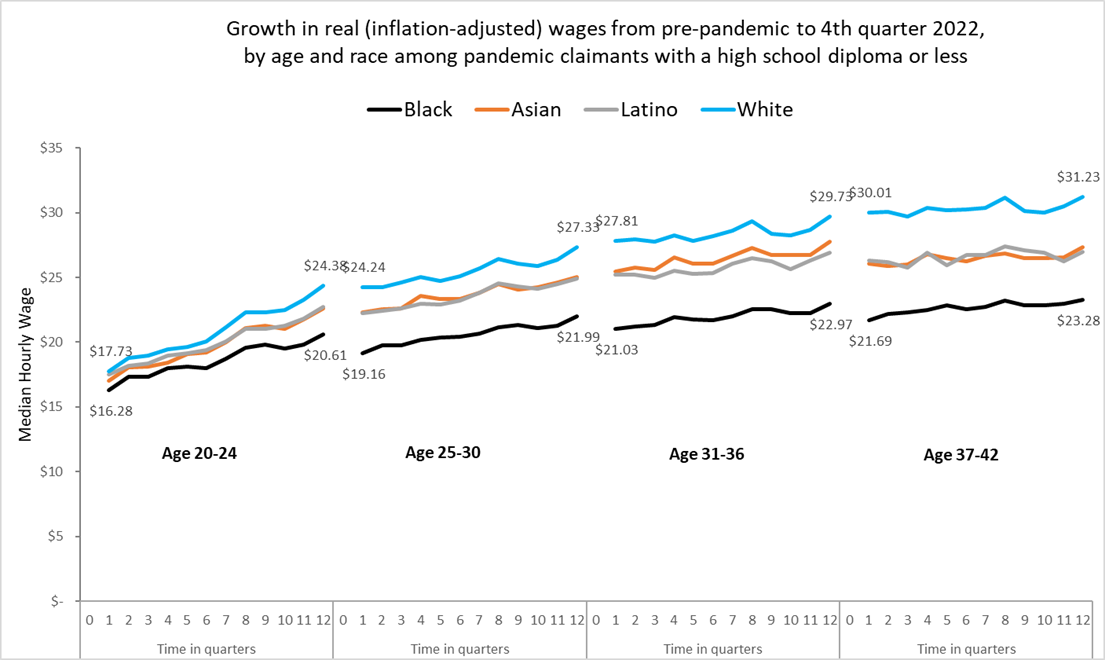
The graph shows that:
Figure 5 displays bachelor's degree holders.
Figure 5
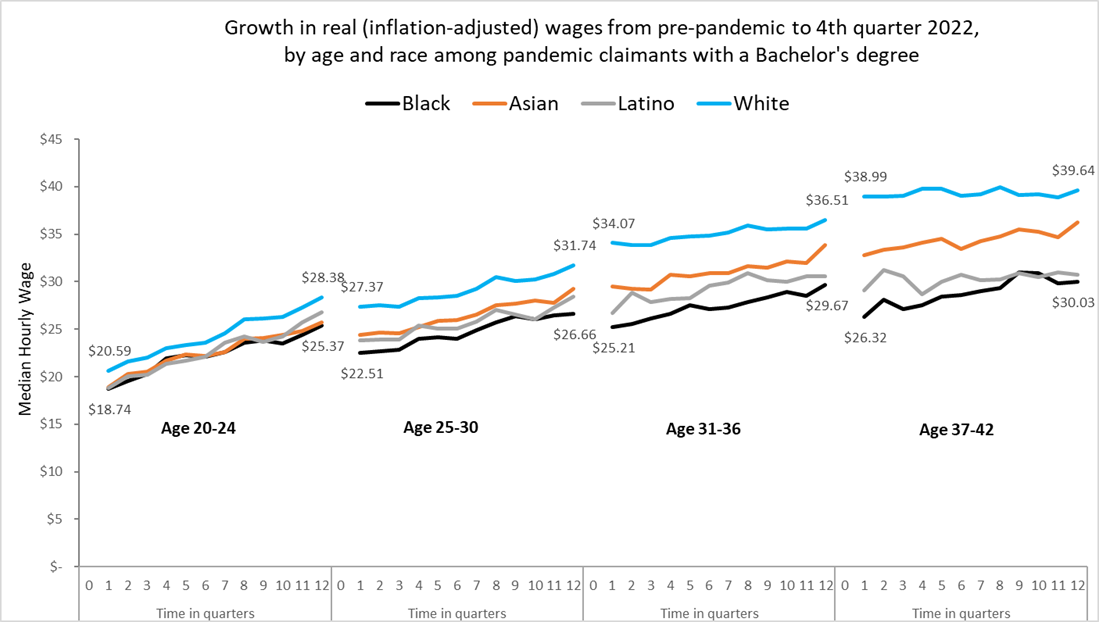
The graph shows that:
The following dashboard shows results for all education levels.
Figure 5 earnings outcomes by education level dashboard
The results clearly show that higher education leads to higher wages, but racial disparities remain stubborn and grow larger with age. The earnings of white claimants surpass those of other racial groups at every education level except master's and above, where Asian claimants out-earn white claimants.
The evidence discussed so far boils down to two main trends:
Racial and ethnic disparities are caused by multiple factors. One factor is quality of schooling, which can vary according to a person's socio-economic status, both at the K-12 level and at the post-secondary level2, shaping future earnings trajectories. Minnesotans of color are also less likely than white residents to pursue degrees in high-earning fields such as STEM3. Furthermore, large differences were found across race in job quality and other measures of labor market disadvantage and may prevent certain race groups from accumulating valuable work experience over the course of their working lives. Two sources of job-related disadvantage are employment in part-time or short-tenured jobs and having an employment history in high turnover industries where career ladders are rarely available.
Differences in earnings are not only determined by differences in education. An even greater impact on earnings is from an individual's occupation, which reflects both career choices and investments in education and job training4. Figure 6 shows that claimants of color were over-represented in lower-skill, lower-pay occupations such as Food Preparation, Food Processing (mostly employed in Manufacturing), Home Health & Personal Care Aides, Nursing Assistants, as well as Janitors, Cleaners and Maids. While white claimants represented 68% of all claimants in our dataset, they made up much smaller shares of occupations in this list relative to claimants of color. For example, Black claimants made up 66.3% of all claimants in Home & Personal Care Aides despite the fact that they represented only 15.6% of the total dataset5. Black claimants were also over-represented in seasonal and high turnover occupations such as Childcare Workers.
Figure 6
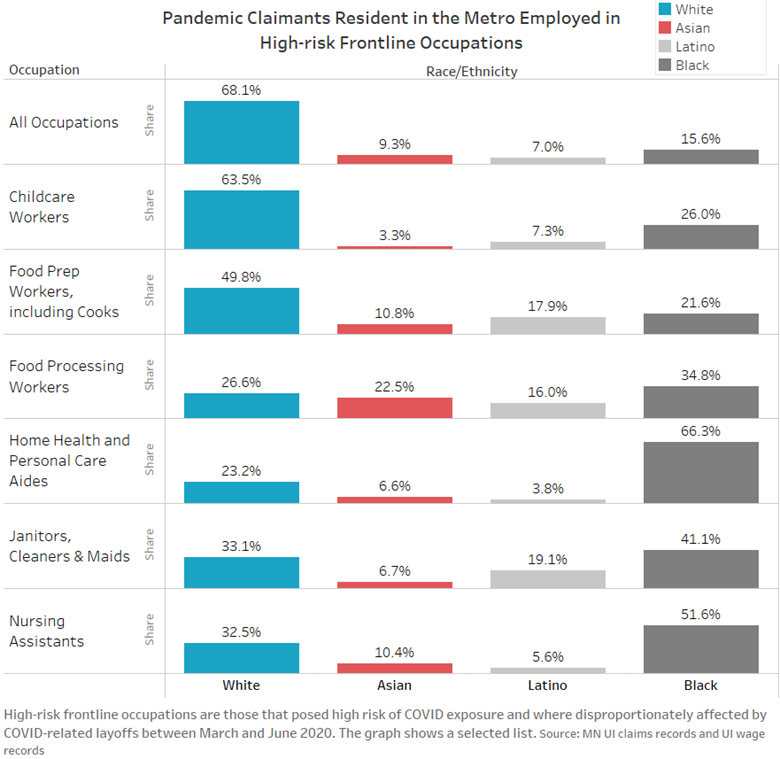
A second dashboard allows users to drill down into the occupational category that claimants reported at the time of layoff in 2nd quarter 2020. Although it shows occupational groups rather than individual occupations, it sheds light on the role of occupational segregation in racial wage gaps.
Occupational segregation occurs in two main ways: first, when workers of color are less likely to pursue high-earning and growth potential careers and training paths than white workers; second, when workers of color pursue these paths but are prevented from entering the targeted career due to biases in hiring and/or promotional opportunities.
Figure 7 gives a snapshot of dashboard results, comparing two occupations in the Healthcare Support category where white workers were under-represented: Home Health & Personal Care Aides and Nursing Assistants. A question we can ask of this visual is: Do racial wage gaps persist within the same occupational category after holding age and education level constant?
We find much smaller or even reversed racial wage gaps. Among Home Health & Personal Care Aides, wages are flat for all race groups. A 37 to 42-year-old worker can expect the same pay as a 20 to 24-year-old because seniority, or greater experience, does not lead to higher wages in this occupation6. White people in this occupation continue to earn more than other racial/ethnic groups, but not by much. Among Nursing Assistants, both Asian and Black people out-earn white people. The trajectory of Asian workers, in particular, is different from other racial groups, perhaps because many switched occupations after 2020, entering better paid ones. Changes in occupation are likely especially between age 20 and 30, but cannot be measured with our data. In conclusion, if white Minnesotans were represented in these occupations at the same rate as Minnesotans of color (see Figure 6), we would see little or no racial wage gaps. This is why occupational segregation matters.
While controlling for occupation commonly reduces gaps, exceptions exist. In the Construction category, for example (Figure 8), gaps remain stubbornly large even when zooming into detailed occupations and education level. Missing or bumpy lines are due to low sample sizes for claimants of color.
While Latino workers occasionally out-earn white workers, the wage gap between white and Black workers as Carpenters and Electricians is staggering. This stems from the fact that two workers with the same job type can be employed in different industry sectors. For example, white Carpenters and Electricians are more likely to be employed in the Construction industry than their Black counterparts. Over time, this leads to a faster accumulation of skills for white Carpenters and Electricians, eventually resulting in higher wages relative to Black workers. There are also generational differences between the age groupings: young workers who attended college recently might be more marketable than workers who attended college decades earlier, unless they had the opportunity to update their skills through on-the-job training. This factor is linked to the previous one: if white workers have easier access to industries that offer on-the-job training, they are at lower risk of skills obsolescence than non-white workers.
Because of these factors, some of which may be driven by racial biases in hiring and job training, two individuals in the same occupation can end up with very different earnings outcomes depending on different opportunities for skills acquisition.
In conclusion, even in occupations that presumably open up career ladder opportunities, Black claimants' earnings generally trail those of other races except in the youngest age range or at high levels of educational attainment.
Breaking down earnings by occupation reveals some success stories for claimants of color. For example:
These success stories demonstrate that Latino and Asian workers have been more successful in finding their niche in Minnesota's labor market relative to Black workers. Once a niche is created, the perception of acceptance in a field will draw more youth from the community into the same field.8 This evidence also points to a key strategy employers can use to draw new talent and fix labor shortages: recruit from communities of color and make training and career advancement opportunities accessible. This will create recruiting networks to motivate and enable more workers of color to pursue the types of jobs that Minnesota employers are struggling the most to fill and that provide good career opportunities.
This study offers a rare look at the role of age, education, and occupation in producing inequalities in lifetime earnings by race and ethnicity. Here is a summary of findings:
Despite the fact that the recovery provided a much-needed wage boost to low-wage workers, the overall findings point to the self-perpetuating and inter-generational nature of racial inequalities and the inextricable relationship between opportunity gaps and skills gaps.
1Since this study is focused on reemployment outcomes, we excluded individuals who were not employed in Minnesota at any time during 2022.
2See Table 2 and Table 3 in Minnesota Economic Trends: How the Deck is Stacked: Racial and Ethnic Disparities in Earnings Following High School Graduation in Minnesota.
3See Figure 3 in Minnesota Employment Review: A Good Job After College.
4Prior research showed how one of the main drivers of racial wage gaps is the racial variation in ability to invest in human capital, of which formal education is just one of many forms. Others are the contributions of time and money that individuals, their parents, their schools and communities (through extra-curricular activities) and their employers make to enhance the individual's skills, including on-the-job training. All of these investments combined help individuals enter and thrive in a specific occupation.
5With the only exception of those claimants who did not report their occupation.
6The 2023 SEIU contract for Personal Care Aides does build in a pay scale based on experience but this does not kick in until 2025.
7This is true not only in our claimants' dataset but in Minnesota as a whole, according to an analysis of postsecondary graduates documented in Figure 3 of this report.