by Cameron Macht and Derek Teed
January 2019

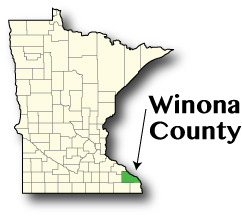
Steeped in Native American history, Winona County is blessed with bluffs and forested valleys; scenic walks, hiking trails, and road trip routes; historical sites and architecture; and tremendous natural beauty and wildlife all focused around the Mississippi River. The famous Sugar Loaf bluff is one of the most distinguishing landmarks in Winona, synonymous with an American Indian legend that paints the rock as the cap of Dakota Chief Wapasha.1
Likewise, the legend of Princess Wenonah tells the tale of a woman of the Wapasha tribe who, rather than being forced to marry someone she didn't love, jumped to her death off a cliff now known as Maiden Rock. Although locals are very familiar with her story, it is still unclear if she is actually the namesake of the county or even real at all.2
With just under 27,000 residents in 2017 the city of Winona was the 34th largest city in Minnesota and one of 17 Micropolitan Statistical Areas in the state.
With over 50,000 people, Winona County is the 19th largest county of 87 in the state. After gaining 888 new residents, it was the 46th fastest growing county, rising 1.8 percent since 2000. Likewise, the county's labor force had grown to 29,290 workers in 2017, which was 334 more workers than in 2000. However, the county's 3.2 percent unemployment rate reflects a tightening labor market – dropping as low as 2.0 percent in October of 2018.
With about 25,000 jobs at 1,156 business establishments, Winona County's economy is chugging along. Manufacturing is still the largest employing industry, accounting for one in every four jobs, after adding 90 net new jobs over the past five years. Winona County has several distinguishing manufacturing industries, including the two largest sectors: with 1,561 jobs in 2017 Computer and Electronic Product Manufacturing is four times more concentrated in Winona County than the state, and at 792 jobs Chemical Manufacturing is nearly eight times more specialized.
Home to Winona State University, St. Mary's University, and Minnesota State College Southeast, Educational Services is also a key industry in Winona County, providing almost 3,300 jobs and a well-prepared workforce for local employers.
1Visit Winona Minnesota. Retrieved from: Visit Winona
2Mitchell, Tesla. "Legend or fact? What to believe about the woman who inspired the Princess Wenonah statue." Winona Daily News. September 21, 2018.
| Economy | ||
|---|---|---|
| 2017 Estimates | Winona County | Minnesota |
| Population | 50,873 | 5,576,606 |
| Labor Force | 29,290 | 3,063,604 |
| Average Unemployment | 3.2% | 3.6% |
| Median Household Income | $53,975 | $65,699 |
| Cost of Living, Individual | $26,374 | $31,656 |
| Cost of Living, Average Family | $45,911 | $57,624 |
| Source: U.S. Census Bureau, DEED Local Area Unemployment Statistics, DEED Cost of Living | ||
| Industry | |||||
|---|---|---|---|---|---|
| Top Employing Industries | 2017 Annual Data | Average Annual Wage | 2012-2017 | ||
| Number of Firms | Number of Jobs | Change in Jobs | Percent Change | ||
| Total, All Industries | 1,156 | 24,688 | $40,978 | -100 | -0.4% |
| Manufacturing | 108 | 5,968 | $54,070 | 90 | 1.5% |
| Educational Services | 21 | 3,292 | $45,107 | 32 | 1.0% |
| Health Care and Social Assistance | 82 | 2,751 | $39,527 | -42 | -1.5% |
| Retail Trade | 146 | 2,605 | $24,540 | -111 | -4.1% |
| Source: DEED Quarterly Census of Employment and Wages (QCEW) program | |||||

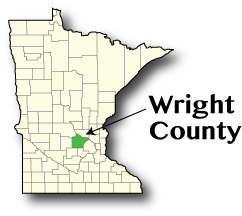
Established in 1855, Wright County was home to just 3,729 residents during their first census in 1860. Since then, Wright County has consistently ranked as one of the fastest growing counties in Minnesota, swelling more than 3,500 percent from 1860 to the present. More recently, Wright was the second fastest growing county in the state from 2000 to 2017, jumping 49 percent. Looking forward, the State Demographic Center projects that Wright County will surpass 150,000 residents by 2040.
Originally settled by German and Swedish immigrants, almost 95 percent of the county's population reports being White Alone. However, every other racial group in the county has been expanding rapidly since 2000. The number of Black or African Americans has increased by 690 percent this century, while the number of Asians and people of Some Other Race or Hispanic or Latino origin all rose by more than 250 percent.
Benefiting from close proximity to the Twin Cities metro area, Wright County's population swelled to 134,286 people in 2017, making it the 10th largest county in Minnesota. With a median household income of just under $78,000 and an average family income surpassing $101,000, Wright County also ranked in the top 10 statewide. However, the $60,755 cost of living for a typical family was also the 11th highest.
Wright County's 75 percent labor force participation rate was third highest in the state. After gaining over 21,000 net new workers since 2000, the county now has just under 75,000 total workers, many of whom work in the surrounding metro areas. According to commuting data from the Census Bureau, Wright County has a net outflow of almost 28,000 workers with nearly 47,000 residents driving outside the county for work compared to just 19,250 commuting in.
Spurred on by all the population and labor force growth, Wright County employers also added jobs faster than the state as a whole, expanding 16.4 percent over the past five years. This included huge gains in key industries like Health Care and Social Assistance, Manufacturing, and Construction.
But with 6,848 jobs, Retail Trade is still the largest employing industry in the county, accounting for 16 percent of total employment. When combined with Accommodation and Food Services, these industries provide more than one in every four jobs in the county, but offer relatively low wages.
| Economy | ||
|---|---|---|
| 2017 Estimates | Wright County | Minnesota |
| Population | 134,286 | 5,576,606 |
| Labor Force | 73,756 | 3,063,604 |
| Average Unemployment | 3.6% | 3.6% |
| Median Household Income | $77,953 | $63,217 |
| Cost of Living, Individual | $35,228 | $31,656 |
| Cost of Living, Average Family | $60,755 | $57,624 |
| Source: U.S. Census Bureau, DEED Local Area Unemployment Statistics, DEED Cost of Living | ||
| Industry | |||||
|---|---|---|---|---|---|
| Top Employing Industries | 2017 Annual Data | Average Annual Wage | 2012-2017 | ||
| Number of Firms | Number of Jobs | Change in Jobs | Percent Change | ||
| Total, All Industries | 3,123 | 43,243 | $41,640 | 6,107 | 16.4% |
| Retail Trade | 401 | 6,848 | $25,963 | 559 | 8.9% |
| Manufacturing | 226 | 6,264 | $56,302 | 1,309 | 26.4% |
| Health Care and Social Assistance | 244 | 6,019 | $38,588 | 1,503 | 33.3% |
| Educational Services | 56 | 4,628 | $42,813 | 595 | 14.8% |
| Source: DEED Quarterly Census of Employment and Wages (QCEW) program | |||||

Although people were less enthusiastic about Prohibition, Granite Falls residents remain proud of local hero Andrew Volstead, the congressman who authored the legislation in 1919 that prohibited the making or selling of alcohol. Although the Volstead Act was repealed in just over a decade, several of his other congressional contributions have stood the test of time, including "champion[ing] anti-lynching legislation and help[ing] farm cooperatives operate without worrying about antitrust provisions."3
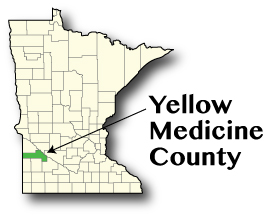
Granite Falls is the largest city and county seat of Yellow Medicine County, a small, rural county in the Minnesota River valley named after a plant used by the Dakota for medicinal purposes. The government established the Upper Sioux Agency in 1854, and after the Sioux Uprising of 1862, settlement in the area began again in 1865. Then existing as part of Redwood County, Yellow Medicine County was officially created by a legislative act in 1871.4
After peaking in 1940, Yellow Medicine County's population was back to 9,867 people in 2017, nearly identical to the county's mark in the 1890 Census. Although the 20th smallest county in the state, Yellow Medicine was the second largest in the Upper Minnesota Valley Economic Development Region. Education and Health Services is easily the largest employing industry in Yellow Medicine County, accounting for one-third of total jobs. Although it is home to the two campuses of Minnesota West Community & Technical College, one in Canby and one in Granite Falls, Yellow Medicine County has seen cuts of about 30 jobs over the past five years, split between the college and elementary and secondary schools. And while Ambulatory Health Care Services was adding jobs, Nursing and Residential Care Facilities was also making deep cuts.
The Upper Sioux Community is a major employer in Yellow Medicine County at Prairie's Edge Casino Resort and several other tribal enterprises, creating a wide range of economic opportunity for residents and visitors. This is reflected in the county's high concentration of employment in Arts, Entertainment, and Recreation and in Public Administration.
| Economy | ||
|---|---|---|
| 2017 Estimates | Yellow Medicine County | Minnesota |
| Population | 9,867 | 5,576,606 |
| Labor Force | 5,408 | 3,063,604 |
| Average Unemployment | 3.6% | 3.6% |
| Median Household Income | $54,645 | $63,217 |
| Cost of Living, Individual | $26,769 | $31,656 |
| Cost of Living, Average Family | $44,597 | $57,624 |
| Source: U.S. Census Bureau, DEED Local Area Unemployment Statistics, DEED Cost of Living | ||
| Industry | |||||
|---|---|---|---|---|---|
| Top Employing Industries | 2017 Annual Data | Average Annual Wage | 2012-2017 | ||
| Number of Firms | Number of Jobs | Change in Jobs | |||
| Total, All Industries | 349 | 3,985 | $36,686 | -295 | |
| Education and Health Services | 33 | 1,354 | $36,192 | -99 | |
| Retail Trade | 48 | 407 | $22,173 | 22 | |
| Arts, Entertainment and Recreation | 9 | 346 | $30,215 | -38 | |
| Public Administration | 20 | 332 | $35,832 | 17 | |
| Source: DEED Quarterly Census of Employment and Wages (QCEW) program | |||||
3Brown, Curt."Minnesota History: Andrew Volstead got skewered even before Prohibition." StarTribune. May 30, 2015.
4"History of Yellow Medicine County, Minnesota…" Yellow Medicine County Minnesota.
Statewide, while technically not a county, is very important to proper geocoding in Minnesota. In it are all the businesses that do not have a fixed location in Minnesota such as wholesale activity from out of state as well as "here and gone'" firms such as contractors who have an unemployment tax account while they do a job and then leave. Statewide also encompasses Internet shopping firms and more manufacturing firms than seem reasonable. The geocode is probably correct, but we check regularly to see if they should be in Wholesale rather than Manufacturing.
Data for Statewide firms do not appear in regional data but are included in the total state data we publish. Labor Market Information geocoders are also working constantly to find location codes in-state where appropriate. New firms do not reach us with geocoding, so each of those is checked for a local address as they appear. For the third quarter we still have about 600 new accounts to code. For second quarter we had the number down to 43 before we pulled in third quarter data.
In the third quarter of 2018 there were 59,375 firms coded to Statewide with average employment for the three months of the quarter at 59,602. All Minnesota out-of-state employment makes up 2.1% of total state employment. Agriculture, Mining, Utilities, Public Administration, and Accommodation and Food services represent an insignificant amount of out-of-state employment and are not included in Table 1.
Table 1 shows a breakdown by major industry:
| NAICS | Industry | Statewide Firm Count | Percent of All MN Firms | Statewide Employee Count |
|---|---|---|---|---|
| 23 | Construction | 1,196 | 0.7% | 3,702 |
| 31-33 | Manufacturing | 748 | 0.4% | 626 |
| 42 | Wholesale Trade | 5682 | 3.2% | 13,224 |
| 44-45 | Retail Trade | 516 | 0.3% | 2,036 |
| 48-49 | Transportation and Warehousing | 413 | 0.2% | 2,095 |
| 51 | Information | 1,435 | 0.8% | 2,730 |
| 52 | Finance and Insurance | 1,194 | 0.7% | 4,508 |
| 53 | Real Estate and Rental and Leasing | 331 | 0.2% | 785 |
| 54 | Professional and Technical Services | 7,216 | 4.0% | 12,374 |
| 55 | Company Management and Enterprises | 330 | 0.2% | 1,043 |
| 56 | Admin and Waste Services | 1,666 | 0.9% | 9,814 |
| 61 | Educational Services | 628 | 0.4% | 1,285 |
| 62 | Health Care and Social Assistance | 557 | 0.3% | 1,548 |
| 71 | Arts, Entertainment, and Recreation | 247 | 0.1% | 461 |
| 81 | Other Services, ex Public Administration | 955 | 0.5% | 1,843 |
| Total | 23,458 | 12.9% | 59,637 |