
by Fernando Quijano, University of Minnesota Extension and Anthony Schaffhauser
September 2024
As the saying goes, a picture is worth a thousand words. This article presents several illustrations of data from DEED's Current Employment Statistics (CES) to track changes in employment and earnings over time. These illustrations shed light on how different industries are impacted by recessions, highlight the unique labor market dynamics of the Pandemic Recession and recovery, and help differentiate between cyclical impacts and longer-term industry evolution. We then use employment and wage illustrations as a case study to illuminate the labor market challenges in Nursing & Residential Care Facilities.
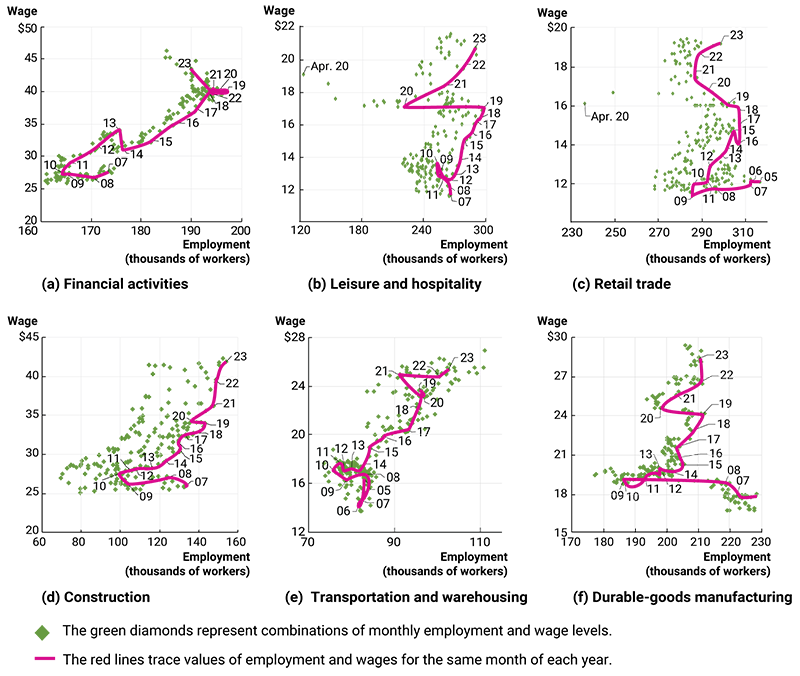
Figure 1 illustrates the monthly changes in employment and wages through two recessions: The Great Recession of 2007 to 2009 and the Pandemic Recession of 2020. The differences in employment recoveries across industry sectors over the last three recessions were well covered in the March 2024 issue of Minnesota Economic Trends. This article intends to build on that work by simultaneously examining wages along with employment.
The Great Recession was triggered by a housing bubble that burst, precipitating a subprime mortgage crisis which spiraled into a broader financial crisis.1 Thus, the epicenter of the Great Recession was Financial Activities, shown in graph (a), with Construction (d) in the immediate blast radius. These two graphs look very similar during the Great Recession and initial recovery timeframe, with employment dropping substantially and wages stagnating from 2007 to 2010 in both industries.
This was followed by a recovery in employment which brought wages up in Financial Activities, but not so much in Construction. Then when Financial Activities employment stagnated from 2013 to 2014, wages dropped. Construction wages perked up as employment continued to recover, however wages did not increase markedly until after 2015 when employment began gaining ground from its 2008 level. Thus, how wages and employment move together signaled the labor market conditions in these two sectors in the Great Recession and initial recovery. Wages only grew when employment increased.
The situation is similar in this period for Retail Trade (c). Wages were extremely responsive, even declining from 2005 to 2009, and then ticking up to front-run employment from 2009 to 2010 and 2011 to 2012. It makes sense with the high turnover in Retail that wages can be lowered in loosening labor markets, with businesses still able to maintain desired staff levels; while wages typically raised for existing employees in tightening labor markets to retain employees, and also for new hires to attract new workers and accommodate staffing increases.
Leisure & Hospitality is another high-turnover, low-wage sector, but graph (b) reflects the greatest layoffs of the lowest-paid employees as demand plummeted in 2009 and 2010. This paradoxically boosted average wages initially.2 Then, restaffing brought wages back down from 2010 to 2012, and since then, recovery employment gains have coincided with wage gains. Transportation & Warehousing (e) has the same general pattern, but wage gains were faster from mid-2013 to 2015, reflecting the fact that employment was back to 2007 levels.
These graphs show employment and wages resuming growth together after the recovery from the Great Recession took hold with an upward and rightward progression. Thus, they show the classic market reaction to a decrease in demand: a decrease in the quantity of workers (employment) and a lower price of labor (wage). This is followed by the classic reaction to the demand increase with employment recovery: an increase in quantity and price. Thus, the relationship between employment and wages shows the economic cycle of a demand decrease followed by recovery.

Like the Great Recession, the Pandemic Recession initially brought a decrease in demand. Thus, from 2019 to 2020 there was a sharp decrease in employment. This continued into 2021 for a large segment of the economy and can be seen for half of the sectors in Figure 1. This was quickly followed by a restart that revealed a decreased supply of labor.
Construction and Transportation & Warehousing fully regained their prior progression of employment, while Retail and Leisure & Hospitality employment lagged. The graphs also show that these two sectors experienced the most drastic employment drop as of April 2020 due to the pandemic.
Notably, all the industries except Financial Activities have enjoyed wage increases after the pandemic hit, indicating a lack of worker supply in the recovery rather than a continued lack of demand. Granted, real wage gains were not realized until wage growth caught up to inflation after it peaked in June 2022. However, inflation was itself initially a response to supply disruption. Inflation also does not impact comparisons between industries.
A decreased supply of workers is a significant and lasting change. As Dave Senf noted in the March 2024 issue, "While the pandemic had a drastic short-term impact on customer-facing sectors, a minimal impact is likely over the long term . . . . Low unemployment and slow labor force growth will probably have more of an effect on workforce growth in Accommodation & Food Services and Other Services than any permanent change arising out of the pandemic."
The extended timeframe of these graphs also reveals non-cyclical, longer term changes for Retail Trade (c) and Durable Goods Manufacturing (f). Neither regained their pre-Great Recession employment levels, even as wages increased along with the other industries. This trend reflects the significant role of technology in reshaping these sectors. Online shopping has dramatically impacted Retail, while automation has transformed Manufacturing. Additionally, increased global trade had been influencing Manufacturing even before the Great Recession began. Thus, these long-term graphs illustrate how different sectors were impacted cyclically and secularly.
The graph also reveals a non-cyclical change in the Financial Activities industry. While employment recovered from 2021 to 2022, it then dropped from 2022 to 2023. At the same time, wages increased at a faster rate than before the pandemic. Several factors contribute to this trend. Higher interest rates have curtailed many financial activities, especially mortgages and real estate loans. Meanwhile, the rise of robotic process automation, as well as artificial intelligence and machine learning has increased demand for high-wage workers while reducing the need for lower-wage positions.
The 2024 BDO CFO Outlook Survey sheds further light on this shift, reporting that 30% of CFOs plan to add new positions requiring unique competencies. "Organizations are increasingly seeking professionals with expertise in areas such as data analytics, cybersecurity, and regulatory compliance, yet professionals with these skills may be hard to find." Competition to hire these professionals pushes up wages in the sector.
So, these graphic relationships of employment and wages compared across sectors reflect important aspects of labor markets. They are an indicator of whether it is supply or demand that has shifted, as well as whether changes are cyclical or secular.
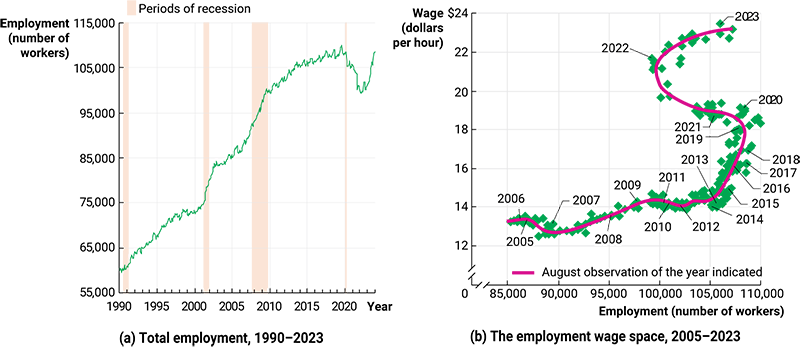
During the prior three recessions, Nursing & Residential Care employment increased (Figure 2 (a)). In other words, this subsector's employment is countercyclical: Jobs increase in recessions rather than decrease as they do economy wide. Those needing care need it regardless of the economic backdrop. Labor is available during recessions, and this subsector can staff up to a level that meets demand. Although employment continued to grow after these recessions, growth was not nearly as fast as during the recessions.
From about 2014 to 2020, employment growth flattened in response to the tightening labor market. Then came the pandemic, which hit this subsector particularly hard. Employment dipped in 2020, like it did across all sectors, but then dropped even more from 2021 to 2022.

Nursing & Residential Care Facilities had a particularly challenging labor market in the Pandemic Recession and recovery. This was mostly due to the difficult circumstances the pandemic created for both direct care workers and those receiving their care, but this was also due to stagnant wages at the same time. Compare the flat wages from 2020 to 2021 in Figure 2 (b) to the wage increases in Retail Trade and Leisure & Hospitality from 2020 to 2021 in Figure 1 (b and c). There was increased competition for workers from these other industries at the same time direct care jobs had become more difficult.
Nursing & Residential Care wages did increase in 2021, but employment did not start to rebound until 2022. The decrease in employment coupled with increasing wages from 2021 to 2022 indicates that the decrease had nothing to do with demand for workers. Demand remained high; the supply of workers decreased.
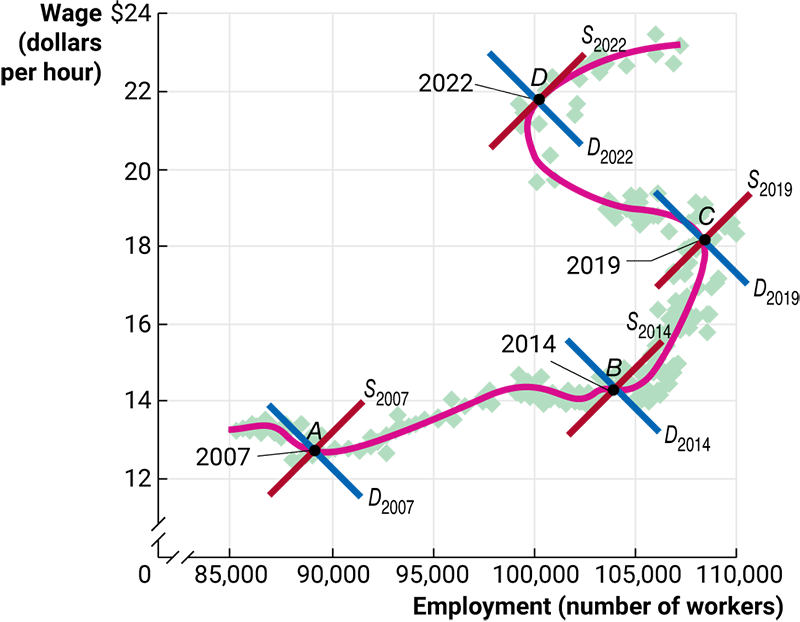
As with Figure 1, the simultaneous movement of employment and wages is useful to identify whether the supply side or the demand side of the labor market is the source of employment and wage changes. Figure 3 below again shows the monthly observations of CES data for Nursing & Residential Care, but this time with a superimposed representation of the supply and demand model in this labor market. (Appendix A has a primer on supply and demand as a model for labor markets.)

The changes over the past 15 years can be broken into three distinct trajectories:
Examining graphs of wages alongside employment through different recessions and recoveries reveals significant differences in how industries are affected by economic downturns and how they recover. This also reveals how labor market dynamics differ between the Great Recession and the Pandemic Recession. These same graphs also help differentiate long-term changes within industries due to factors like technology, expanded global markets, and long-term changes in consumer preferences or behavior, as opposed to oscillations of the business cycle.
Finally, a more in depth look at employment and wage illustrations for Nursing & Residential Care Facilities provides a case study of how distinct features and changes in labor markets can be illuminated by these graphics. These insights carry important implications for Minnesota's policymakers, business leaders and workforce. They suggest a need for:
As Minnesota navigates the post-pandemic economy, understanding these nuanced industry dynamics will be crucial. The interplay between employment levels and wages provides a valuable tool for gauging the health of our labor markets and the effectiveness of our economic policies.
Figure 4 below highlights how changes in employment and wages are connected to changes in supply and demand. Point A (left pane) depicts equilibrium in the market, or the wage at which the quantity of workers available (or supplied) coincides with the quantity demanded. The wage of equilibrium reflects all information about supply and demand at a point in time (or monthly observation of CES data). This never really happens. It just represents the tendency of the labor market. If there is a shortage of workers, wages tend to increase.

The center pane shows the change in employment and the wage when supply shifts to the right or to the left while demand remains the same. The right pane shows the same for changes in demand along a stationary supply curve.
For either demand or supply, a shift to the right represents an increase and a shift to the left represents a decrease. Lower supply or higher demand leads to higher wages, while higher supply or lower demand leads to lower wages. Thus, rising wages with decreasing employment suggests a supply decrease, whereas declining wages with declining employment suggests a decline in demand.
This does not necessarily fit the CES data entirely because of the different occupations in an industry, each with their own labor markets. For example, the increase in wages in Leisure & Hospitality from 2008 to 2010 was from more front-line workers being laid off than higher-paid management and operations professionals, initially increasing average wages. However, it does fit well enough to distinguish the drop in employment from the Great Recession's drastic decrease in demand from the Pandemic Recession recovery's decrease in labor supply.
1The so-called "shadow banking system" is a network of financial institutions including investment banks, money market funds, and mortgage companies that perform bank-like activities but operate outside the normal banking regulations. These businesses held a lot of mortgage-backed securities that were high-risk loans wrapped up in complex financial instruments that obscured the risk and had grown to nearly the size of the traditional banking system. When investors lost confidence credit markets froze and financial turmoil ensued.
2This so-called "compositional effect" often occurs with large layoffs as the lowest-paid workers are often the first to be laid off and laid off in much larger percentages thereby bringing average wages up. The national CES data have average weekly hours for "production" non-supervisory workers and for all workers including supervisory. The hours for non-supervisory decreased -5.4% from 2007 to 2010, but only decreased -3.6% for all employees. That represents a significantly greater drop in lower-paid worker hours. This effect has been well documented for the Pandemic Recession.