
by Mustapha Hammida
March 2022
We all know that the COVID-19 pandemic had a devastating impact on jobs, at least in the short term. But taking a deeper dive into each major industry – and subsectors within those industries – reveals the disparate impact pandemic safety measures, personal behavior and other COVID-19 related changes have had on job loss and recovery in specific sectors and subsectors. This article examines how the job recovery has progressed from May 2020 up to September 2021 using the most comprehensive and recent data available on employment.
This article analyzes the monthly employment at each business location in the Quarterly Census of Employment and Wages (QCEW) program. The QCEW program is a complete count of Minnesota employer establishments that include jobs covered by the Unemployment Insurance program, which accounts for about 95% of jobs in the state. Some excluded jobs include those held by certain farm and domestic workers, self-employed people, railroad workers, and elected officials. The QCEW program collects counts of monthly workers and their wages and publishes seasonally unadjusted quarterly counts of businesses, employment and wages that are released about five months after the end of the quarter. As of this writing, the most recent available data is from the third quarter of 2021.
The monthly employment counts are used to develop various sets of time series spanning the period January 2000 to September 2021. Each set of time series is seasonally adjusted using the X-13-ARIMA-SEATS (acronym for autoregressive integrated moving average, signal extraction in ARIMA time series) software developed by the Census Bureau. The goal of seasonally adjusting the time series is to identify and remove regular seasonal patterns and to isolate the underlying trends in the employment series, specifically peaks and troughs. Figure 1 illustrates seasonality in the Minnesota monthly employment series.
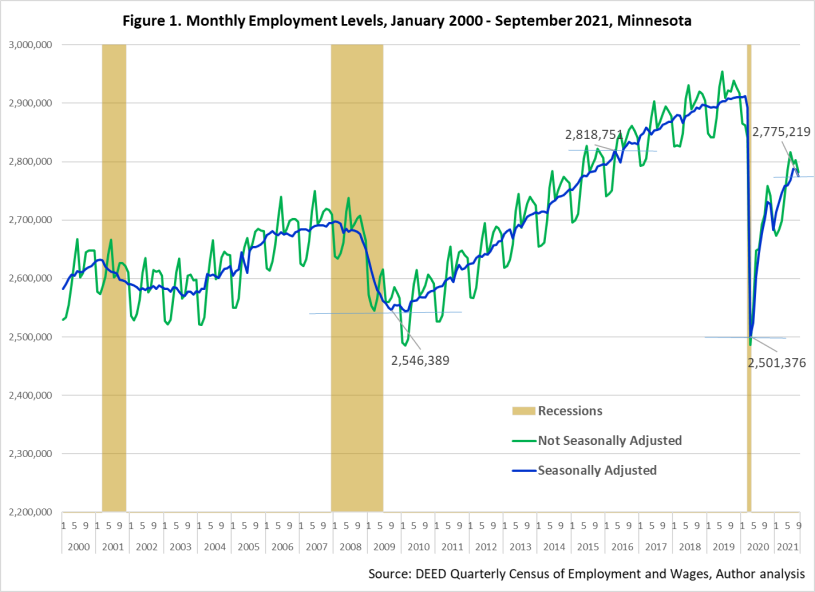
To gauge the employment recovery, it is important to grasp the extent of the employment deficit caused by COVID-19 pandemic. Officially1, the COVID-19 recession lasted only two months, making it the shortest recession on record, but in sharp contrast to historical norms, it still resulted in massive job losses. According to seasonally adjusted employment from the QCEW2, Minnesota businesses lost 410,900 jobs, or 14.1% from peak employment level of 2,912,200 in February 2020, by April 2020. The magnitude of these job losses not only erased all employment gains made in the longest recovery on record that followed the Great Recession, but also brought employment to its lowest level since 2000 (Figure 1).
Figure 2 gives the month-to-month employment gain and the percent employment loss relative to the peak employment level of February 2020 in each month from March 2020 to September 2021. Although the COVID-19 recession was officially over by May 2020, COVID-19's grip on the economy continued through September 2021 (and continues to have an impact now). Figure 2 shows Minnesota employment experienced two cycles of expansion and contraction during the pandemic. The first expansion lasted six months, from May 2020 to October 2020. By October 2020, the economy added a net3 of 230,000 jobs or grew by an overall rate of 7.9% from the employment level of April 2020, bringing the percent employment loss relative to the pre-pandemic peak employment level of February 2020 down to 6.2%. This means that over the first expansion phase, Minnesota employers were able to recover close to three-fifths (56%) of the 410,900 jobs lost during the COVID-19 recession. Therefore, the job deficit stood at 180,900 jobs in October 2020.
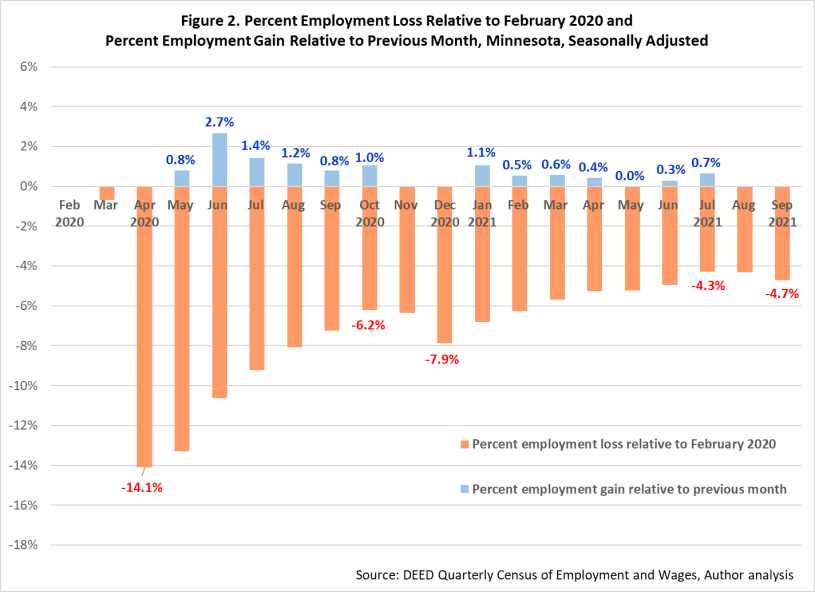
As COVID-19 cases increased in late October4 and new restrictions ensued in November to curtail the spread, employment again contracted during November and December 2020. As a result, Minnesota employers shed 48,600 jobs from November to December 2020, raising the job deficit to 229,500 and back to down 7.9% from the peak employment level of February 2020.
For the next seven months, another burst of employment gains followed, but with less vigor than during the first phase of expansion. Between January and July 2021, Minnesota businesses added 104,600 jobs, which is a growth of 3.6%, in aggregate, bringing down the job deficit from the peak employment level to 4.3% or 124,900 jobs. Thus, 15 months after the end of the COVID-19 recession, Minnesota employers added an impressive 334,500 jobs. This job expansion can be divided into two recovery parts. The first one includes 48,600 jobs to account for the job loss during November and December 2020. The second part contains the remaining 286,000 jobs representing the recovery of 70% from the 410,900 jobs lost during the COVID-19 recession.
Of course, COVID-19, not tamed yet, continued its assault on the economy. By August 2021, cases started expanding again and another job contraction followed extending into September 2021, the last month of data we had available at the time of analysis for this article. During these two months, the economy shrunk, though only slightly compared to the previous two two-month contractions, losing only 12,100 jobs. By September 2021, the job deficit rose to 137,000, bringing jobs down 4.7% lower than of the peak employment level of February 2020.
Therefore, about one and a half years after the end of the COVID-19 recession, the number of jobs recovered stood at 273,800 or two-thirds of the COVID-19 recession job deficit. While the loss was spectacular, the recovery was as well. Between May 2020 and September 2021 Minnesota employers added an average of 16,100 jobs per month. This is a massive month-to-month average growth rate of 0.6% over this period (Figure 2, bars above the horizontal axis).
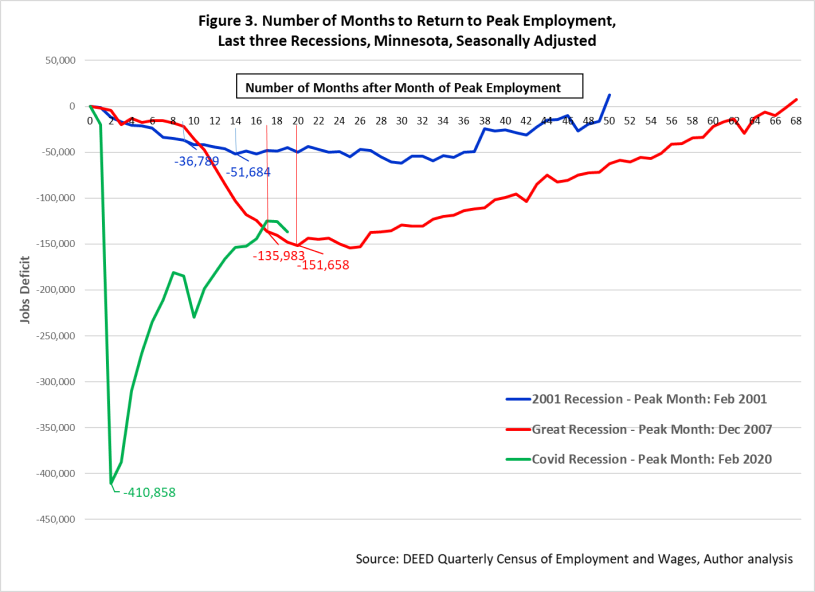
Figure 3 gives the extent of the job decline from peak employment in the last three recessions in Minnesota and the number of months elapsed before returning to pre-recession peak employment levels. The job losses during the COVID-19 recession dramatically eclipse those of the previous two recessions. The Minnesota labor market lost 51,700 jobs in the 2001 recession, which corresponds to only about one-eighth of the job loss due to COVID-19, and 154,000 jobs in the Great Recession, which is just over one-third of the job loss due to COVID-19.
In addition to the size of job losses in each recession, it is important to determine when job contraction ended in each recession for a comparison of pace and duration of job recoveries to be reliable. Simply looking at the period between the months of peak employment and of return to this peak employment overestimates the recovery period. While the job losses during the COVID recession were contained to only within the official duration of the recession (two months), they continued even after the official end date of the recession in the previous two recessions.
Although the 2001 recession officially lasted eight months (from March 2001 to November 2001), the Minnesota labor market suffered 14 consecutive months of job contraction starting in March 2001. During the 2001 recession, the state lost 36,800 jobs from a peak employment of 2,632,000 jobs in February 2001. However, the economy continued to shed jobs for another five months sinking the job deficit to 51,700 jobs from the peak employment level, or 1.9% in relative terms. It took Minnesota businesses three years to erase this job deficit, adding an average of 1,800 jobs per month, which translates into a monthly growth rate of 0.11%. This is the length of recovery period and not the 50 months between the peak employment of February 2001 and the month of once again reaching that peak employment.
The Great Recession, the longest U.S. recession on record, dragged on for 17 months in Minnesota and shaved 136,000 jobs from the peak employment of 2,698,000 jobs in January 2008. Just as with the 2001 recession, residual effects of a weaker economy lingered for another three months bringing the job deficit to 151,700 jobs from, or 5.6% of the peak employment level. After these 20 recessionary months, a steady labor market recovery lasting four years and adding a monthly average of 3,300 jobs (or 0.13% every month) eliminated this job deficit.
Compared to the job recoveries from the previous two recessions, the current job recovery from the COVID-19 recession is outstanding in many respects. First, in just four months, between May and August 2020, businesses added a net of 176,100 jobs, which is more than the whole job deficit experienced during the Great Recession and more than three times the job deficit of the 2001 recession.
Second, by September 2021 and 17 months since the trough employment, Minnesota's economy expanded by 273,800 jobs. Moreover, this impressive job recovery excludes an additional expansion of 60,700 jobs that balanced the additional job contractions that occurred as COVID-19 cases jumped. In just a year and a half, Minnesota employers added 334,500 jobs, an experience not even close to matched in speed of job recovery in that length of time over the whole period studied here (since 2000). During the expansion that followed the Great Recession, it took the economy about six and a half years (79 months) to achieve similar job gains. The labor market grew by 272,400 jobs from 2,546,400 jobs in September 2009 to 2,818,800 in April 2016 (Figure 1). In addition, separating months of job expansion from months of job contraction reveals that Minnesota employers added 349,800 jobs during this period.
Finally, the pace to employment full recovery is likely to remain relatively faster than during the previous two recoveries. Although the economy has vastly improved and made great strides in reducing the job deficit created by the COVID-19 recession, it is not easy to forecast when employment will fully recover back to its pre-pandemic peak employment level. Some complicating factors include whether and when future variants of COVID-19 will emerge and more importantly whether and when the economy will return to its normal functions of pre-pandemic time.
A simple approach assumes that current and recent past economic behavior continues into the near future. Therefore, assuming a continuation of the seasonal trajectory of COVID-19 cases and the path of employment change as experienced from October 2020 to September 2021, wherein the economy added a monthly average of 6,200 jobs, it would take 22 months to erase the job deficit of 137,000 jobs. At this pace, the Minnesota labor market will return to its pre-pandemic peak employment by July 2023, making the recovery duration three years and three months.
However, growth will likely be slower than this. Based on job data from the Current Employment Statistics program, Minnesota has gained an average of 5,420 jobs per month from September 2021 to February 2022.
Furthermore, according to a more robust approach, Minnesota's short-term jobs forecast program projected a growth rate of 2.1% between third quarter 2021 and third quarter 2022. Applying this rate to the employment level of September 2021 yields an annual growth of 59,700 jobs, which is about 5,000 jobs per month. At this rate, the Minnesota economy will be back at its pre-pandemic peak employment by December 2023, or after 3 years and eight months of recovery.
Clearly, the exact full recovery date hinges on our society's ability to win the battle with COVID-19, or at least move from a pandemic to an endemic where COVID-19 remains present, but its spread is predictable, and most people are protected through vaccination and/or previous exposure. Many current signs are promising for a near victory, most importantly: high vaccination rates and falling numbers of severe cases and rates of hospitalization and mortality.
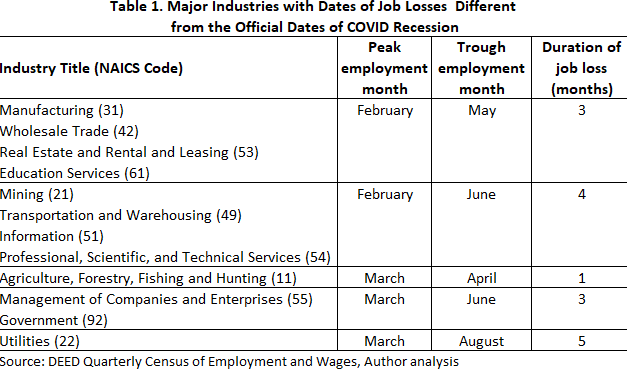
Before we assess how the early job recovery progressed across industries, we need to determine for each industry the months of peak and trough employment and the size of the job loss caused by COVID-19. First, most industries experienced a duration of job contraction that was longer than the official two-months of the COVID-19 recession (Table 1), with the Utilities industry experiencing the longest stretch of monthly job losses at five months, from March to August 2020. As a result, the total job loss computed from industries is larger (431,900 jobs) than the one computed from overall employment (410,900 jobs), since some industries lost jobs for a longer period of time than the economy overall.
Second, although no major industry escaped unscathed from the COVID-19 recession's negative impact on jobs, industries that rely mostly on interactions between staff and clients were most devastated. Levels and percent of industry job losses between peak and trough months during the COVID-19 recession are given in Figures 4 and 5 (bottom bar), respectively. Approximately three-fourths (or 319,600 jobs) of all job losses in the COVID-19 recession were in just six industries. Each of these industries suffered high job losses in both level as well as rate (more than 25,000 jobs lost and a rate greater than the state average of 14.1%) except for Health Care and Social Assistance, where only the level was high.
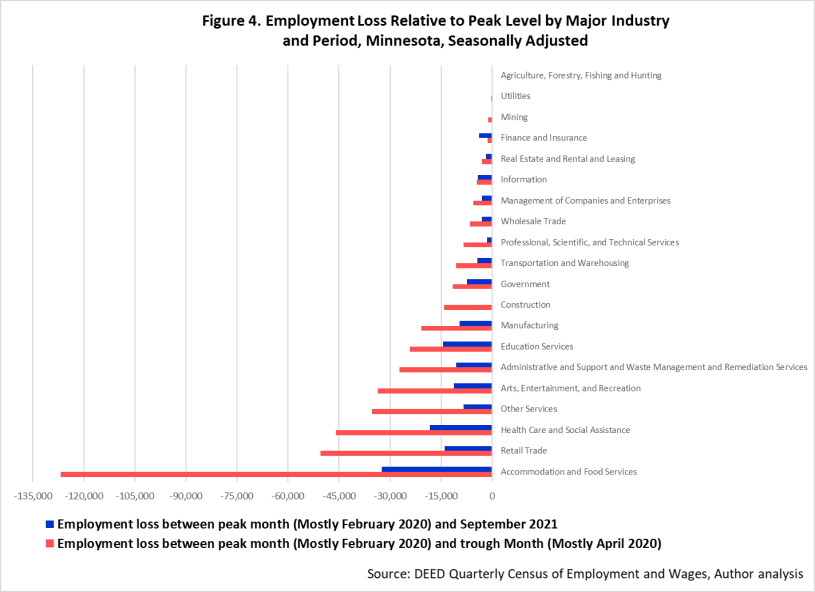
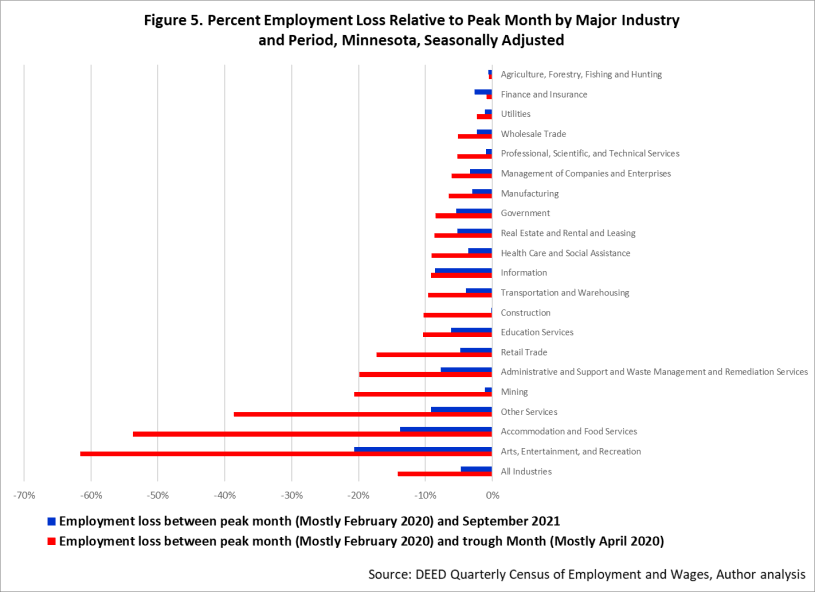
The Accommodation & Food Services industry alone accounted for 29.4% of all jobs lost during the COVID-19 recession, losing 126,900 jobs. This loss wiped out over half (53.7%) of the peak employment in this industry, making it the second most negatively impacted industry. The most negatively impacted industry was Arts, Entertainment, & Recreation, which saw 61.6% (33,700 jobs from) of its peak employment disappear between February and April 2020. The third most negatively impacted industry was Other Services, with job losses amounting to 38.6% (35,200 jobs from) of its peak employment. These three industries collectively lost 195,900 jobs in two months, which is more than all jobs lost in the state during the 20 months of job contraction in the Great Recession. The other three industries with significant jobs losses during the COVID-19 recession are Retail Trade, Health Care & Social Assistance, and Administrative & Support & Waste Management & Remediation Services that lost 50,500 (17.3%), 46,000 (9.0%), and 27,200 (19.9%) jobs from their peaks, respectively.
In the remaining 14 major industries, job losses due to COVID-19 were moderate to mild but not exceeding one-tenth of their respective peak employment levels. Between February and May 2020, employment fell in Educational Services by 24,200 jobs or 10.3% and in Manufacturing by 20,900 jobs or 6.5%. The other 12 industries collectively lost 67,200 jobs, or one-sixth of the state's total job contraction. The lowest job loss in value and percent was in Agriculture, Forestry, Fishing & Hunting industry at 100 jobs and 0.5%. In addition, this industry was the only industry where the COVID-19 recession lasted only one month (Table 1).
Just as the impact of the COVID-19 recession on employment was different across industries, so was the early employment recovery. Figures 4 and 5 give the levels and percent of job loss between the month of peak employment and September 2021 (top bar) for each industry, respectively. Comparing this bar to the bottom bar in Figures 4 and 5 gives the extent of the jobs recovered by September 2021. When the top bar fades out at the zero mark of the horizontal axis, then all lost jobs are recovered as of September 2021; and when it crosses to the positive side of the horizontal axis, then job recovery has ended, and job growth has started.
As of September 2021, no major industry had employment that was larger than its peak employment of February 2020. However, it is important to note that a (negative) job deficit in September 2021 does not preclude that a recovery could have occurred sometime before September 2021. It simply indicates that employment in September 2021 was lower than the peak employment. In fact, three industries had returned to their peak employment before September 2021. The Agriculture, Forestry, Fishing & Hunting industry recovered its minor job losses by May 2020, and since then its employment went into an ebb and flow reaching levels higher than the peak employment of March 2020 and levels lower than the trough employment of April.
The other two industries are Mining and Construction. Construction businesses not only erased the job deficit of 14,100 jobs (or 10.3% of peak employment level) in exactly one year, but also grew by 1,900 jobs (or 1.3%) by July 2021 over the peak employment of February 2020. However, by September 2021, this job growth disappeared, and employment fell below the peak employment of February 2020 by 200 jobs (or 0.1%), amounts too small to be visible on Figures 4 and 5.
Unlike Construction, businesses in Mining were able to recover the jobs lost due to COVID-19, but no job growth followed. It took these businesses only ten months to add back all 1,200 jobs lost (20.7% of peak employment level). However, in May 2021 employment quickly contracted - albeit not by much - and stayed below the peak employment of February 2020 for the next four months. By September 2021, employment was less than 100 jobs (or 1.1%) below the peak employment of February 2020.
Although employment in both Mining and Construction fell again below their peak employment levels, they both were still posting the largest job recoveries by percentage of growth of all industries as of September 2021. The percentage of jobs recovered in Mining and Construction was 94.5% and 98.6%, respectively.
Businesses in the six industries that lost the most jobs during the COVID-19 recession were hard at work chipping away at their industry job deficit. Amazingly, they added 224,600 net new jobs between April 2020 and September 2021, about four-fifths of all jobs added in all industries. With this enormous job expansion, their collective job deficit shrank by 70.3% from 319,600 to 95,000 jobs. Between these six industries, the highest reduction in job deficit, or percent employment recovery, was in Other Services at 76.2%, while the lowest was in Health Care & Social Assistance at 60.1%.
The Accommodation & Food Services industry enjoyed the second highest percent of jobs recovered, at 74.4%. This industry added a net 94,400 jobs to its trough employment level of 109,300 jobs; that is a gigantic growth rate of 86.3%. By September 2021, the job deficit stood at 32,500 jobs from the high of 126,900 jobs, or 13.8% of peak employment (from the high of 53.7%) (see Figures 4 and 5).
It is important to remember that these figures summarize employment changes between the month of trough employment and September 2021, and as such ignore job expansions and contractions that cancel out between these two months. Figure 6 presents the monthly job deficit in each of the six industries most impacted by COVID-19. Businesses in Accommodation & Food Services have added an additional 43,000 jobs that balanced out the contraction of 41,600 jobs of November and December 2020 and the contraction of 1,400 jobs of September 2021. This means that since COVID-19 arrived in Minnesota, it caused the Accommodation & Food Services industry to lose 169,900 jobs (126,900 plus 43,000) of which the industry so far has been able to recover 128,400 jobs (94,400 plus 43,000).
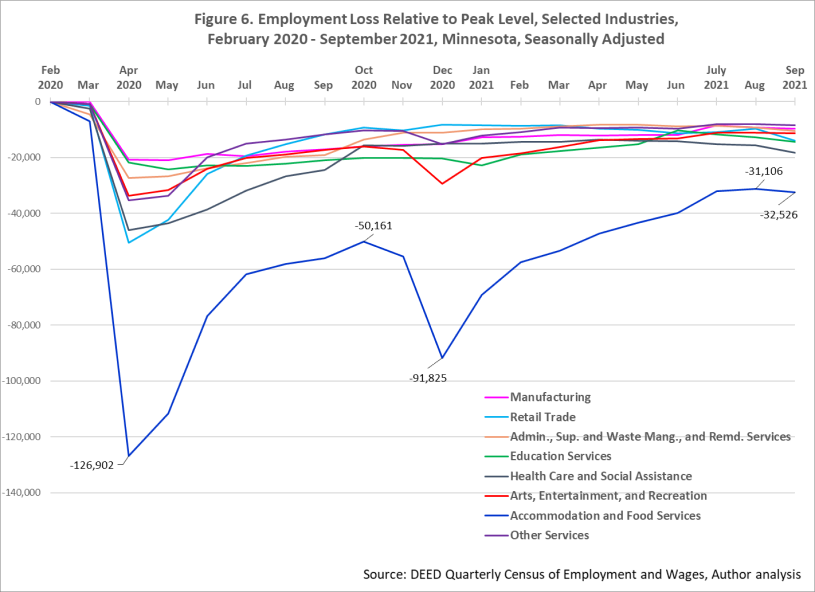
Job recovery was also significant in Arts, Entertainment, & Recreation, which lost over three-fifths of its jobs, the highest of all industries. After reaching a trough employment level of 21,000 jobs in April 2020, employment expanded by 22,400 jobs by September 2021, an unprecedented growth rate of 106.9% in this industry. As a result, the remaining job deficit receded by two-thirds to 11,300 jobs. In addition, and like Accommodation & Food Services, the job expansion was much bigger. Businesses in Arts, Entertainment, & Recreation added an additional 13,500 jobs that balanced the 13,200 jobs that were lost in November and December 2020 and another 300 jobs lost in September 2021 (Figure 6).
Similarly, the other four hard-hit industries achieved great employment expansions after the COVID-19 recession. Employment in Retail Trade expanded by 36,600 jobs, reducing the job deficit by 72.4%, while employment in Administrative Support & Waste Management & Remediation Services rose by 16,700 jobs, lowering the job deficit by 61.3%. These figures exclude 8,300 jobs and 2,500 jobs added to balance job contractions that occurred after the end of the recession in Retail Trade and Administrative Support & Waste Management & Remediation Services, respectively. The jobs recovered in both these industries provided growth of 15% from their respective trough employment levels.
Finally, most of the remaining industries achieved excellent-to-good employment recoveries. Businesses in Professional, Scientific, &Technical Services led the way with a recovery of 81.3% of the jobs lost in the recession. Other job recoveries varied from a high of 58.8% in Transportation & Warehousing to a low of 36.2% in Public Administration.
Not all industries were as fortunate to record significant job recovery. The COVID-19 recession eliminated 4,500 jobs from Information, and in September 2021, the job deficit was 4,300. Businesses in this industry normally post small numbers of monthly job gains and this pattern remained unchanged after the COVID-19 recession. Thus, most jobs added in this industry were quickly erased in November to December 2020 and again in August to September 2021. While employment in Information barely changed between April 2020 and September 2021, employment in Finance & Insurance continued to fall after a short spell of job recovery. Finance & Insurance is the only industry where job losses worsened after the end of the COVID-19 recession. This industry lost 1,300 jobs of which 700 jobs (or 62.6%) were recovered by October 2010. However, since November 2010 employment is stuck in a downward trend, that expanded the job deficit to 3,900 jobs, three times its size during the COVID-19 recession. Although the trend is worrisome, this job deficit represents only 2.6% of the peak employment in February 2020. Employment in Finance & Insurance will likely rebound after this slump as the return of workers to the office accelerates and consumers' demand for in-person services increases. Minnesota's short-term jobs forecast program projects an expansion of 1,100 jobs between third quarter 2021 and third quarter 2022 in this industry.
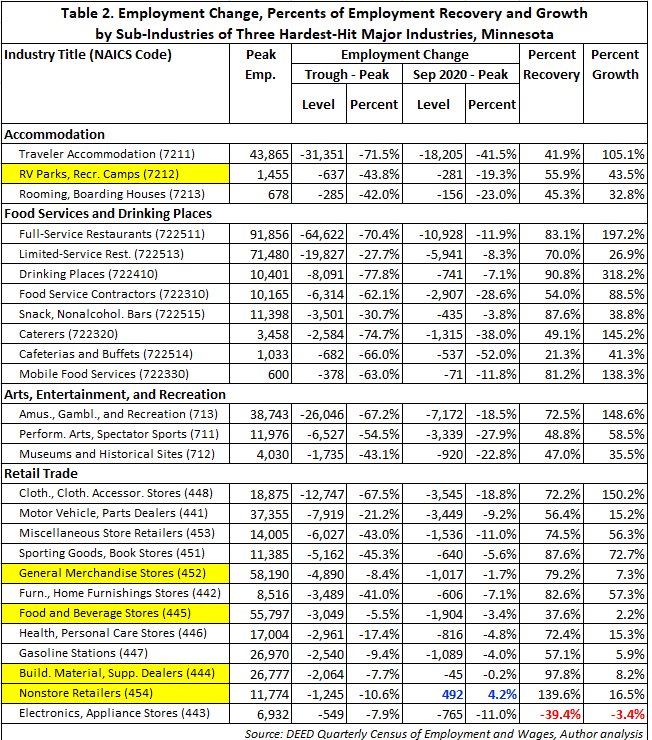
The discussion so far has focused on the 20 major industries, or sectors. Each sector is further broken into four levels of detail as defined by the North American Industry Classification System or NAICS. In this section, we will peek inside selected industry subsectors5 of the three industry sectors hardest-hit by COVID-19. We analyze the industries within each of Arts, Entertainment, & Recreation and Retail Trade at their 3-digit NAICS subsectors. However, we analyze the Accommodation & Food Services sector at its 4-digit NAICS Accommodation subsectors and 6-digit NAICS Food Services subsectors to provide the best insights. Table 2 presents the employment change6 between peak and trough months and between peak month and September 2021, showing the percent of jobs recovered and the percent growth from the trough employment level for these selected detailed industry subsectors.
Most of the patterns in the COVID-19 job contraction and recovery observed at the sector level are also present across the subsectors, but not all their individual subsectors suffered similar misfortunes.
Within Accommodation & Food Services, which lost 53.7% of its peak employment level during the COVID-19 recession, the lowest job deficit was 27.7% in Limited-Services Restaurants, while the highest job deficit was 77.8% at Drinking Places. Similarly, within Retail Trade that experienced a job deficit of 17.3% of peak employment, the job deficit across its subsectors varied from a low of 5.5% in Food & Beverages Stores, an essential industry, to a high of 67.5% in Clothing & Clothing Accessories Stores, a non-essential industry. Thus, the COVID-19 recession influenced different subsectors of the same sector differently (Table 2).
Second, the job losses during the COVID-19 recession were also more concentrated in a few subsectors of these three sectors. In Accommodation, most job losses were in Traveler Accommodation with 97.1% jobs lost in this subsector. Similarly, Full-Service Restaurants accounted for 61.0% of all jobs lost in the Food Services subsector. Within the Arts, Entertainment, & Recreation sector, 75.9% of job losses were in Amusement, Gambling, & Recreation. All these industries rely heavily on human interaction with customers, so social distancing and other measures to keep customers and workers safe affected employment severely during the COVID-19 recession.
Third, just as job contractions were uneven within an industry sector, so were job recoveries. For example, in Retail Trade, some subsectors have already fully recovered (Table 2, rows highlighted in yellow), some have made a big dent in their job deficits, but in the Electronics & Appliance Stores subsector, the job deficit has worsened. Employment in Non-store Retailers returned to its peak level in October 2020 and has since entered a growth period. The pandemic spurred employment growth in e-commerce as many brick-and-mortar stores continue to struggle.
In the Food Services subsector as of September 2021, except for Cafeterias, Grill Buffets, and Buffets that only recovered about one-fifth of its job deficit, all other industries recovered at least half of their job deficit, with Drinking Places leading the way at 90.8% (from 8,100 to 700 jobs lost). Not too far behind are Full-Service Restaurants and Limited-Service Restaurants that reduced their job deficits from 64,600 to 10,900 jobs (or 83.1% recovery) and from 19,800 to 5,900 jobs (or 70.0% recovery), respectively.
Similarly, all three subsectors of the Arts, Entertainment, & Recreation sector have recovered at least close to half of their job deficits. The Amusement, Gambling, & Recreation subsector reduced its job deficit from 67.2% of peak employment, the highest within its sector, to 18.5%, the lowest within the sector.
This uneven job recovery within sectors is also obvious when we look at the rates of job growth between the trough employment level and employment in September 2021. Within each of the three hardest-hit sectors, the subsectors experienced job growth rates that were significantly different (Table 2, last column). For example, in the Accommodation & Food Services sector, employment growth in Drinking Places and Full-Service Restaurants outpaced all other subsectors. While employment more than tripled in Drinking Places and doubled in Full-Service Restaurants, it grew only 26.7% in Limited-Service Restaurants. Similar large differences in job growth rates occurred in Arts, Entertainment & Recreation and Retail Trade.
A year and a half after the end of the COVID-19 recession, Minnesota's labor market posted its best job recovery since 2000, recovering two-thirds of the jobs lost with the addition of 273,800 jobs. While most industries chipped in, job gains were most remarkable in the most hard-hit industries, in particular Accommodation & Food Services. Job gains varied across major industries and within, with few industries already recovered and many on differing paths to recovery.
Even though jobs are rebounding, challenges resulting from the pandemic continue to impede the job recovery. Pressures from supply chain disruptions, lower labor force participation, worker shortages, changing preferences for work, and jumps in the prices of goods and services add to the uncertainty of the recovery pace and path. Future growth depends on the ability of policymakers, businesses, workers, and consumers to overcome these challenges.
1US Business Cycle Expansions and Contractions
2The estimated peak employment level and the job loss due to COVID-19 using the seasonally adjusted monthly employment data from the QCEW are slightly different (lower) from those obtained using the monthly Current Employment Statistics survey of nonfarm businesses. According to CES seasonally adjusted employment estimates, the COVID-19 recession resulted in a loss of 417,600 jobs, or 13.9% of peak employment of 2,995,500 in February 2020, which is 83,300 jobs higher than the QCEW-based estimate. Comparing seasonally adjusted employment levels between CES and QCEW from January 2000 to September 2021, CES estimates are consistently higher than QCEW estimates by a monthly average of 79,400 jobs. For a discussion of differences between the two programs see "Nick, Dobbins, September 2018, Variations in Employment in the CES and QCEW Programs.
3In this article, job gains (or losses) refer to a net change in employment, which is simply the difference between employment levels at two months. They are not synonymous with hires (or separations), respectively.
4Situation Update for COVID-19
5The term "subsector" in this article is used loosely to mean any subdivision of a major industry and does not necessarily correspond to the definition used in NAICS terminology wherein a "subsector" refers to 3-digit NAICS subdivision.
6The total employment change from the subdivisions of a major industry may be different from the employment change reported for the major industry because peak and trough employment months at the subdivision industries may not coincide with those of the major industry.