By Tim O'Neill
February 2019
Another new year for Employment Review presents another new series of analysis. Where Employment Review previously analyzed occupations by the alphabet, and then moved on to county snapshots, it's time to highlight industries within the State of Minnesota. More specifically, Employment Review will be digging into the three-digit North American Industrial Classification System (NAICS) codes, alphabetically, of course. At this level, there are just about 100 industries to cover, although some will be left out because of their extremely low employment levels in Minnesota. First in line: Accommodation.
Traveling around the State of Minnesota? Looking for a place to spend the night? Whether it's in a hotel, motel, casino hotel, bed-and-breakfast, RV (recreational vehicle) park, or rooming and boarding house, these types of establishments are housed (pun intended) within the Accommodation industry. More specifically, Accommodation includes those specific industries that provide lodging or short-term accommodations for travelers, vacationers, and others.
As of annual 2017, 1,465 establishments supplied just under 35,000 jobs in Accommodation. Top-employing occupations within this industry typically require less education and have lower median wages, but are highly in-demand across the state (see Table 1).
| Table 1. Accommodation Top-Employing Occupations | ||||
|---|---|---|---|---|
| Occupation | Employment | Median Wage | 2016-2026 Employment Change | |
| Numeric | Percent | |||
| Maids and Housekeeping Cleaners | 16,310 | $11.96 | 1,542 | 8.0% |
| Hotel, Motel, and Resort Desk Clerks | 4,420 | $10.27 | 368 | 9.5% |
| Waiters and Waitresses | 50,180 | $10.06 | 1,269 | 2.5% |
| Maintenance and Repair Workers | 23,020 | $20.56 | 1,610 | 6.9% |
| Cooks, Restaurant | 28,240 | $13.03 | 1,832 | 7.2% |
| Dining Room and Cafeteria Attendants | 4,420 | $10.27 | 133 | 3.4% |
| Janitors and Cleaners | 45,680 | $13.86 | 3,986 | 8.2% |
| Bartenders | 16,490 | $10.01 | -152 | -0.9% |
| Gaming Dealers | 2,100 | $9.88 | 112 | 4.1% |
| Lodging Managers | 530 | $19.65 | 53 | 8.7% |
| Source: BLS Industry-Occupation Matrix, DEED Occupational Employment Statistics (OES), DEED Employment Outlook | ||||
While almost half of Accommodation employment within the state is located in the Twin Cities Metro Area, high concentrations are found in Northeast Minnesota and Northwest Minnesota. Where these two regions make up about 13 percent of the state's total employment, they make up about 28 percent of the state's Accommodation employment (see Table 2). After dipping below 31,000 statewide jobs in 2010 during the Great Recession, Accommodation gained nearly 4,000 jobs through 2017. This growth rate of 12.8 percent slightly outpaced the total employment growth of all industries during that period of time and equaled 11.3 percent. Taking a look through the planning regions, you will notice a large spike of Accommodation employment in Central Minnesota. Much of this could be from establishment reporting, more specifically switching from Casinos to Casino Hotels (see Table 2).
| Table 2. Accommodation Employment in Minnesota | |||||
|---|---|---|---|---|---|
| Area | Number of Firms | Number of Jobs | Share of Minnesota Accommodation | 2010-2017 Job Change | Average Annual Wage |
| Minnesota | 1,466 | 34,942 | 100.0% | 3,966 (12.8%) | $26,468 |
| Metro Area | 353 | 16,235 | 46.4% | 670 (4.3%) | $31,772 |
| Northwest MN | 402 | 5,794 | 16.6% | 724 (4.3%) | $19,292 |
| Central MN | 146 | 4,873 | 13.9% | 3,114 (177.0%) | $24,232 |
| Northeast MN | 268 | 3,867 | 11.1% | 131 (3.5%) | $19,656 |
| Southeast MN | 159 | 2,941 | 8.4% | 86 (3.0%) | $21,060 |
| Southwest MN | 100 | 992 | 2.8% | -935 (-48.5%) | $14,612 |
| Source: DEED Quarterly Census of Employment and Wages (QCEW) | |||||
With numerous Public Administration industry titles starting off with "Administration of," this alphabetical run-through of in-depth industry sectors in Minnesota starts off with a heavy look into government employment in the state. This next industry, Administration of Housing Programs, Urban Planning, and Community Development, is broken down into two main areas:
While this month's industry snapshots take a look at three industries within Public Administration, they are each distinct in how they are distributed amongst the local, state, and federal levels. For example, both Administration of Economic Programs and Administration of Environmental Quality Programs have significant shares of their respective employment within state and federal government. Public Administration as a whole has about one-third of its total employment at the state and federal government levels. Yet only 3.7 percent of Administration of Housing Programs, Urban Planning, and Community Development employment is within state and federal government, equivalent to about 100 jobs (see Table 1). The vast majority of the work done by those in this industry is at the local level.
| Table 1. Administration of Housing Programs, Urban Planning, and Community Development Employment in Minnesota, 2017 | ||||||
|---|---|---|---|---|---|---|
| Industry | Number of Firms | Number of Jobs | Federal Government Share | State Government Share | Local Government Share | Average Annual Wage |
| Total Government Employment | 6,831 | 382,529 | 8.4% | 21.0% | 70.6% | $52,676 |
| Public Administration | 3,358 | 132,054 | 8.6% | 23.4% | 68.0% | $56,264 |
| Admin. Of Housing Programs, Urban Planning, and Community Development | 118 | 2,762 | 3.2% | 0.5% | 96.3% | $63,700 |
| Source: DEED Quarterly Census of Employment and Wages (QCEW) | ||||||
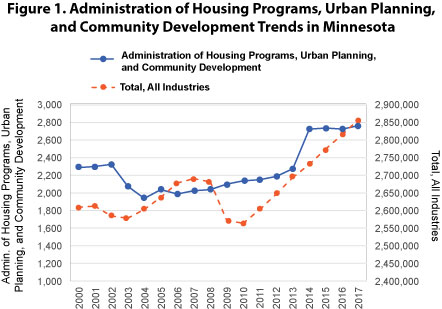
Between 2002 and 2004, Administration of Housing Programs, Urban Planning, and Community Development lost 387 jobs, contracting by 16.7 percent. Over the next decade, between 2004 and 2014, the industry gradually regained these jobs. A 19.8 percent spike in employment or 449 jobs between 2013 and 2014 especially helped out. As of annual 2017, there were 118 establishments in Administration of Housing Programs, Urban Planning, and Community Development supplying 2,762 jobs. Employment levels between 2014 and 2017 have remained largely stable (see Figure 1). Note that where the Seven-County Metro Area accounts for just over half (53.9 percent) of the state's total Public Administration employment, the region accounts for 75.7 percent of the state's total employment in Administration of Housing Programs, Urban Planning, and Community Development.

With just over 132,000 jobs, Public Administration includes a number of industries essential to the administration, oversight, and management of public programs at the federal, state, and local levels. One of these specific industries is Administration of Economic Programs. Broken down, this industry includes:
One of the most distinguishing things about Administration of Economic Programs is its much higher share of employment in both federal and state government, as opposed to local government employment. This industry also has higher average annual wages than Public Administration employment or total government employment in the state as a whole (see Table 1).
| Table 1. Administration of Economic Programs Employment in Minnesota, 2017 | ||||||
|---|---|---|---|---|---|---|
| Industry | Number of Firms | Number of Jobs | Federal Government Share | State Government Share | Local Government Share | Average Annual Wage |
| Total Government Employment | 6,831 | 382,529 | 8.4% | 21.0% | 70.6% | $52,676 |
| Public Administration | 3,358 | 132,054 | 8.6% | 23.4% | 68.0% | $56,264 |
| Administration of Economic Programs | 417 | 7,676 | 34.4% | 49.9% | 15.7% | $60,684 |
| Source: DEED Quarterly Census of Employment and Wages (QCEW) | ||||||
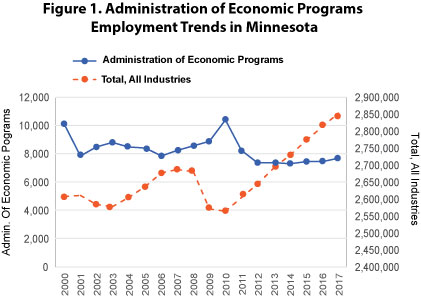
Interestingly, where the Great Recession caused total employment in Minnesota to decline by 4.7 percent between 2007 and 2010, equal to over 125,000 jobs, Administration of Economic Programs witnessed employment growth of 26.4 percent or nearly 2,200 additional jobs. After losing 3,040 jobs between 2010 and 2012, this industry's employment has remained largely unchanged, growing by 4.4 percent between 2012 and 2017 (see Figure 1).

Along with Administration of Economic Programs, Administration of Environmental Quality Programs is another defined industry within Public Administration. Broken down, Administration of Environmental Quality Programs includes two main in-depth sectors:
Establishments within Administration of Environmental Quality Programs are essentially responsible for ensuring the environmental security of Minnesota's land, water, and air, as well as overseeing the conservation of fish and wildlife. As Table 1 highlights, this work is being done at the local, state, and federal levels. Common names for agencies across these levels of government employment include Environmental Quality Board, Farm Service Agency, Fish and Wildlife Office, Land Management Department, Solid Waste Management, Natural Resources Conservation, as well as the Minnesota Department of Natural Resources. Much of the work being done within these agencies and programs is making sure that current and future Minnesotans can enjoy the natural benefits of the state, from bluff country in the southeast to the western prairie grasslands to the northern lakes and rivers.
| Table 1. Administration of Environmental Quality Programs Employment in Minnesota, 2017 | ||||||
|---|---|---|---|---|---|---|
| Industry | Number of Firms | Number of Jobs | Federal Government Share | State Government Share | Local Government Share | Average Annual Wage |
| Total Government Employment | 6,831 | 382,529 | 8.4% | 21.0% | 70.6% | $52,676 |
| Public Administration | 3,358 | 132,054 | 8.6% | 23.4% | 68.0% | $56,264 |
| Admin. Of Environmental Quality Programs | 463 | 8,243 | 16.1% | 41.6% | 42.3% | $56,836 |
| Source: DEED Quarterly Census of Employment and Wages (QCEW) | ||||||
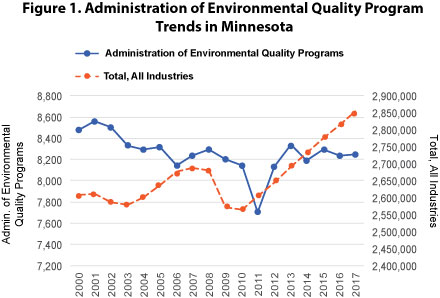
Employment within Administration of Environmental Quality Programs generally trended downwards between the turn of the century and 2010. More specifically, this industry lost 343 jobs during that decade, contracting by 4.0 percent. The industry then experienced some whiplash, losing 441 jobs between 2010 and 2011, before regaining 429 jobs between 2011 and 2012. Since 2012, employment in Administration of Environmental Quality Programs has remained largely stable, growing by 1.4 percent through 2017. For reference, the total of all industries grew by 7.9 percent between 2012 and 2017 (see Figure 1). As of 2017, there were over 8,200 Administration of Environmental Quality Programs jobs in Minnesota at 463 establishments.
