by Luke Greiner
August 2017

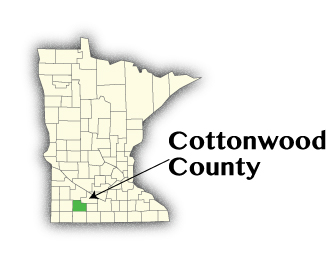
Organized in 1870, Cottonwood County was named appropriately after the abundance of cottonwood trees on the banks of Cottonwood River. Rich soil contributed to a transformation of the gently rolling hills from native prairie grass to corn, soybeans, and other agricultural commodities and livestock. Cottonwood County is the fourth largest producer of broiler chickens in Minnesota.
In the heart of farm country just north of the Iowa border, Cottonwood County has struggled to maintain a population that peaked in 1960 and has since declined 29%. The current residents are also significantly older than the typical Minnesota population, with 23 percent older than 65 years compared to 15 percent statewide. This shift and decline of population and labor force has also decreased the number of jobs in the county, from 5,194 in 2010 to 4,444 in 2016. Employment actually increased in the county during the recession while statewide employment was decreasing and reached its low in 2010, the same year Cottonwood County employment peaked. While the data are less than rosy, low unemployment rates and record numbers of job openings provide residents with excellent opportunities.
Health Care and Social Assistance is the largest employing industry in Cottonwood County, with 1,254 jobs at 48 establishments. The next largest industry is Trade, Transportation, and Utilities, with 852 jobs at 118 firms, accounting for nearly one in five jobs in the county. Prior to the recession Manufacturing provided more jobs than any other industry (1,464 jobs in 2006), but after shedding more than 630 jobs, Manufacturing is now the third largest industry. The Financial Activities and Construction industries had the highest average annual wages, both over $47,000.
| 2016 Estimates | Cottonwood County | Minnesota |
|---|---|---|
| Population | 11,470 | 5,519,952 |
| Labor Force | 5,524 | 3,003,576 |
| Average Unemployment | 7.3% | 3.9% |
| Average Annual Income (2015) | $59,565 | $80,444 |
| Cost of Living, Individual | $24,969 | $29,856 |
| Cost of Living, Average Family | $42,579 | $55,200 |
| Source: U.S. Census Bureau, DEED Local Area Unemployment Statistics, American Community Survey, DEED Cost of Living Survey | ||

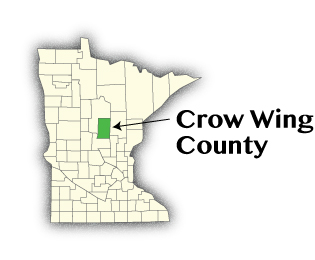
When an early French explorer discovered an island where the Crow Wing River joins the Mississippi River that was shaped like the wing of a crow, the river and county names were the result. Crow Wing County was established in 1857 with Brainerd as the county seat. Often referred to as "cabin country", Crow Wing County has over 400 lakes and 75 rivers with over 2,000 miles of shoreline, more than the driving distance between Minneapolis and Los Angeles, CA.
Since 2000 the population of Crow Wing County has grown 31 percent faster than Minnesota overall, although due to an older age profile, the labor force growth during the similar period was roughly the same as the state's. Projected labor force continues a much slower increase. 2020-2030 is projected to be just 0.8% of available workers compared to population growth during the same period, projected to be 3.2 percent.
2,044 business establishments provide Crow Wing County with over 29,000 jobs across a wide range of industries, with employment heavily concentrated in Health Care and Social Assistance, amounting to one in five jobs. Retailers in Crow Wing County cover 16% of all jobs. In the last year (2015-2016) employment growth was positive in all but seven of the 18 industry subsectors.
Economy| Rank | Top Industries of Employment | Total Employment 2016 | Percent Change 2006-2016 | Average Annual Wages | Percent Change 2006-2016 |
|---|---|---|---|---|---|
| - | Total, All Industries | 4,444 | -13.8% | $36,296 | 38.5% |
| 1 | Education and Health Services | 1,254 | -2.2% | $35,724 | 40.5% |
| 2 | Trade, Transportation, and Utilities | 852 | -11.2% | $33,176 | 38.4% |
| 3 | Manufacturing | 828 | -43.4% | $42,744 | 39.8% |
| 4 | Construction | 307 | 10% | $47,112 | 43.1% |
| Source: DEED Quarterly Census of Employment and Wages 2006-2016 | |||||
| 2016 Estimates | Crow Wing County | Minnesota |
|---|---|---|
| Population | 63,940 | 5,519,952 |
| Labor Force | 31,636 | 3,003,576 |
| Average Unemployment | 5.1% | 3.9% |
| Average Annual Income (2015) | $65,630 | $80,444 |
| Cost of Living, Individual | $27,528 | $29,856 |
| Cost of Living, Average Family | $48,691 | $55,200 |
| Source: U.S. Census Bureau, DEED Local Area Unemployment Statistics, American Community Survey, DEED Cost of Living Survey | ||
| Rank | Top Industries of Employment | Total Employment 2016 | Percent Change 2006-2016 | Average Annual Wages | Percent Change 2006-2016 |
|---|---|---|---|---|---|
| - | Total, All Industries | 29,029 | 0.1% | $38,064 | 28.4% |
| 1 | Education and Health Services | 8,051 | 11.9% | $43,576 | 29.1% |
| 2 | Trade, Transportation, and Utilities | 6,093 | -7.0% | $31,408 | 26.9% |
| 3 | Leisure and Hospitality | 4,035 | -1.8% | $16,848 | 37.3% |
| 4 | Professional and Business Services | 2,063 | 15.6% | $42,588 | 19.0% |
| 5 | Construction | 1,858 | -16.0% | $53,924 | 31.3% |
| Source: DEED Quarterly Census of Employment and Wages 2006-2016 | |||||

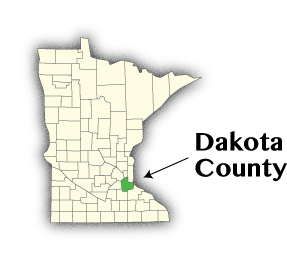
Once an oak savanna, Dakota County is now the third most populous county in Minnesota with over 400,000 residents. In 1689 fur trader Nicholas Perrot proclaimed possession of the territory from American Indians for the nation of France without consent of the tribes, although the Louisiana Purchase transferred ownership to the United States in 1805. The county seat is Hastings, although it was originally Kaposia and then Mendota.
With over 74 percent of the population 16 years and older participating in the labor force, Dakota boasts the fourth highest Labor Force Participation rate in Minnesota, tied with Dodge County. The projected labor force growth is 4.9% from 2020-2030, double that of the state. In contrast, the labor force declined in 2009 and 2010 and remained below pre-recession levels until 2016. Minnesota also experienced a slight decline during that period but by 2011 the number of workers had already eclipsed pre-recession levels.
Employment growth in Dakota County has largely mirrored the state economy as a whole, albeit slightly faster. Two supersector industries are still significantly below their 2006 employment levels, Information and Construction, down 20.7% and 11.6%, respectively. Professional and Business Services and Manufacturing remain flat, while Education and Health Services and Financial Activities have both grown over 23 percent.
| 2016 Estimates | Dakota County | Minnesota |
|---|---|---|
| Population | 417,486 | 5,519,952 |
| Labor Force | 233,145 | 3,003,576 |
| Average Unemployment | 3.4% | 3.9% |
| Average Annual Income (2015) | $93,456 | $80,444 |
| Cost of Living, Individual | $31,708 | $29,856 |
| Cost of Living, Average Family | $61,055 | $55,200 |
| Source: U.S. Census Bureau, DEED Local Area Unemployment Statistics, American Community Survey, DEED Cost of Living Survey | ||
| Rank | Top Industries of Employment | Total Employment 2016 | Percent Change 2006-2016 | Average Annual Wages | Percent Change 2006-2016 |
|---|---|---|---|---|---|
| - | Total, All Industries | 186,813 | 7.0% | $51,480 | 14.4% |
| 1 | Trade, Transportation, and Utilities | 48,540 | 7.6% | $48,360 | 25.3% |
| 2 | Education and Health Services | 36,032 | 25.2% | $43,160 | 110.8% |
| 3 | Manufacturing | 19,582 | 0.7% | $65,364 | 24.8% |
| 4 | Leisure and Hospitality | 18,886 | 8.6% | $17,680 | 23.2% |
| Source: DEED Quarterly Census of Employment and Wages 2006-2016 | |||||

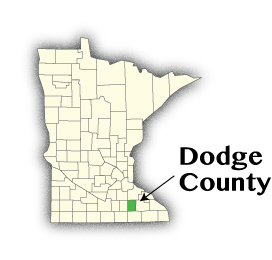
In the mid-19th century Dodge County was home to a mischievous plot that staged a "gold strike" in a town named Sacramento. As it turned out, the gold nuggets were planted along the Zumbro River to create hype and excitement to the benefit of a single man. The plot worked well enough for Sacramento to thrive to the point of being able to challenge Mantorville for the county seat in 1857. Early residents likely found more fortune from the rich soil and timber.
Although Dodge County is younger than Minnesota, with 34.6 percent under 25 years compared to 32.6 in Minnesota, 70 percent of the population growth in the last decade and a half were from residents 55 and older. The demographic shift leads to negative labor force projections from 2020-2030, declining by 1.4 percent or 167 fewer available workers. Historically low unemployment rates compliment a high labor force participation rate among residents 16 years and older. Despite having lower educational attainment, the median household income in the county is $68,116, 11 percent higher than Minnesota.
Dodge County's employment growth outpaced the state from 2006-2016, but in the last year (2015-2016) employment growth went backwards, declining by 0.4% compared to Minnesota's 1.4% growth during the same period. Although the loss was minimal, amounting to just 21 fewer jobs, 2016 proved to be a significant change from the post-recession expansion.
| 2016 Estimates | Dodge County | Minnesota |
|---|---|---|
| Population | 20,506 | 5,519,952 |
| Labor Force | 11,474 | 3,003,576 |
| Average Unemployment | 3.8% | 3.9% |
| Average Annual Income (2015) | $79,597 | $80,444 |
| Cost of Living, Individual | $29,068 | $29,856 |
| Cost of Living, Average Family | $50,396 | $55,200 |
| Source: U.S. Census Bureau, DEED Local Area Unemployment Statistics, American Community Survey, DEED Cost of Living Survey | ||
| Rank | Top Industries of Employment | Total Employment 2016 | Percent Change 2006-2016 | Average Annual Wages | Percent Change 2006-2016 |
|---|---|---|---|---|---|
| - | Total, All Industries | 5,924 | 6.7% | $42,796 | 26.2 % |
| 1 | Manufacturing | 1,506 | -1.2% | $57,252 | 25.1% |
| 2 | Trade, Transportation, and Utilities | 1,246 | 14.1% | $43,524 | 27.0% |
| 3 | Education and Health Services | 994 | 15.7% | $35,464 | 21.8% |
| 4 | Construction | 482 | 5.5% | $51,948 | 45.0% |
| Source: DEED Quarterly Census of Employment and Wages 2006-2016 | |||||