
by Carson Gorecki
June 2022
The decline of the labor force has been the story of the last two-plus years in our world of labor market analysis. It has also been a primary story for the thousands of employers struggling in the real world to fill vacant positions. And while the labor market has tightened across the state and country, there are signs that Northeast Minnesota has faced relatively stronger labor force headwinds.
Preceding Northeast Minnesota's pandemic-induced labor force decline were decades of relatively weak labor force growth. From 2000 to 2019, Northeast had a net gain of just 754 additional people who were working or looking for work (see Figure 1). Compared to an average labor force of 165,000, that amounts to very little growth, in fact the smallest among the state's planning regions (see Figure 2).
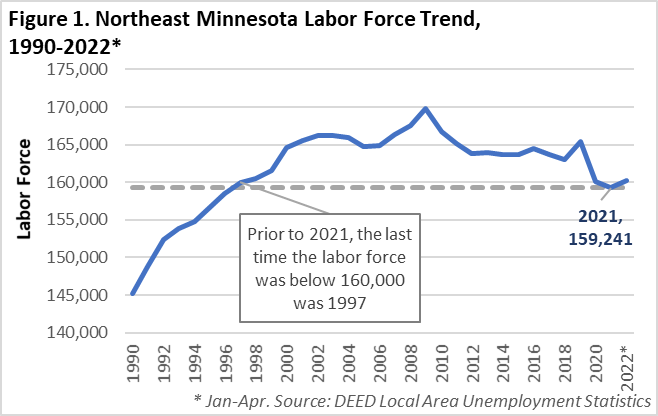
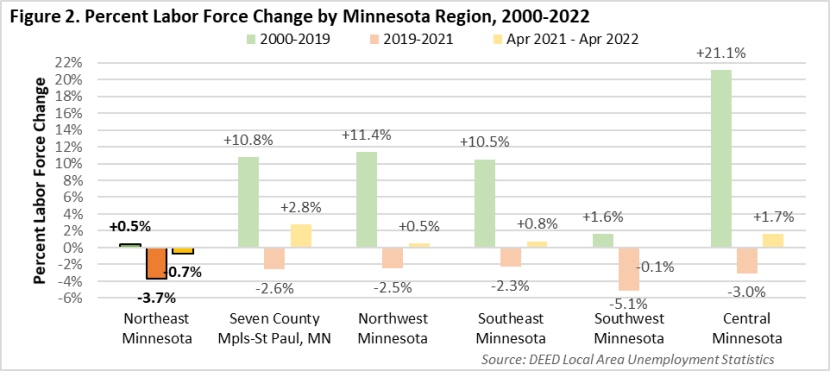
Then came the pandemic which led many workers to leave the labor force for a variety of reasons including lack of child care, health concerns, and earlier-than- planned retirement . In Northeast, from 2019 through 2021, nearly 6,200 (-3.7%) workers stopped working or looking for work. Only Southwest Minnesota saw a relatively larger labor force decline over that period. Since the low point of labor force in October 2020, the general trend has been one of growth as 3,230 workers joined or rejoined the labor force ranks in Northeast through April 2022. More recently, however, the growth trend has reversed. More than 1,100 workers left the labor force between April 2021 and April 2022.
What is behind this labor force decline double-whammy? Mostly it is demographics. Northeast's population has been older than the state average for decades. As a result, a larger share of our workforce is 55 years or older. Older workers were more likely to leave the labor force since March 2020 and Northeast has relatively more of them. Yet this cannot be the entire story. Southwest Minnesota has a larger share of its workforce aged 55 years or older and also saw an above average 2019-2021 decline.
But Northwest Minnesota, which has a labor force even older than Northeast and Southwest, fared better and has not seen the same declines.
Another potential contributor to the differing labor force declines is industry mix. Northeast has relatively larger shares of employment in service sectors like Leisure & Hospitality and Other Services, which saw the worst employment losses in 2020, perhaps pushing more workers out of the labor force. Conversely, Northwest had higher shares of employment in the production sector that saw smaller employment declines, keeping its economy more insulated.
Northeast Minnesota also felt the impacts of the pandemic more acutely in terms of employment when compared to other planning regions. From 2019 into 2020, the region lost over 8% of employment, surpassing the rest of the state. In terms of recovery following the initial pandemic-induced losses, the region lagged behind the state average. Into 2021, Northeast added jobs more quickly than Central and Southwest Minnesota, however those two areas did not have such large losses in 2020. The result is that Northeast, at -6.3%, still had the largest employment deficit relative to pre-pandemic levels (see Figure 3).
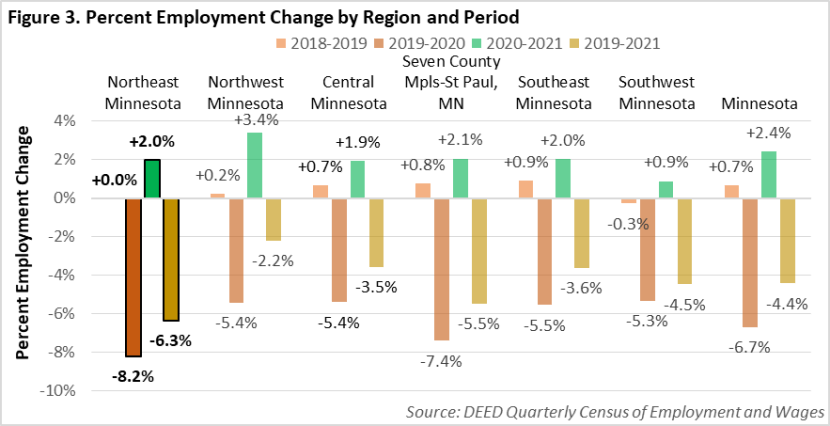
The -6.3% decline over two years equates to a loss of nearly 9,200 jobs. More jobs were lost in Central (-9,900) and the Twin Cities Metro (-97,200), but those regions had double and 12 times the employment as Northeast, respectively.
There are many and overlapping potential reasons for the relatively more severe employment losses Northeast saw over the last two-plus years. The composition of the labor force, as discussed earlier, may be one. Another likely reason is the types of jobs and industries that are more concentrated in the region. The pandemic's impacts on employment varied greatly depending on the function and activities of a given industry or business. Industries that depend more on face-to-face interaction were more susceptible to temporary closures, disruption, or decreased demand for their goods and services. Other industries may have faced more indirect consequences such as increased uncertainty and costs of operating, particularly as inflation rose in recent months.
Northeast has a higher concentration of Leisure & Hospitality jobs, some of the hardest hit in 2020. The sectors that saw the largest relative employment losses statewide in 2020 were Arts, Entertainment & Recreation (-31.5%), Accommodation & Food Services (-24.6%), and Other Services (-15.3%). Northeast had higher than average employment concentrations in each of those sectors, but also saw larger than average employment losses in some sectors that fared relatively well across the state. Northeast fared worse than average in 13 out of 20 sectors, but that did not include Arts, Entertainment & Recreation or Accommodation & Food Services.
However, it did include Health Care & Social Assistance, which statewide from 2019-2020 fell only -2.9%. In Northeast, the sector that accounts for one out of every four jobs fell 4.3%. Notable sectors that fared better and were more concentrated were Retail Trade, Educational Services, and Public Administration.
| Table 1. Industry Wages in Northeast Minnesota, 2019-2021 | ||
|---|---|---|
| Industry | Average Annual Wage | Wage Growth 2019-2021 |
| Mining | $114,192 | +16.9% |
| Arts, Entertainment, & Recreation | $28,483 | +16.4% |
| Management of Companies | $98,982 | +15.3% |
| Retail Trade | $31,317 | +15.0% |
| Accommodation & Food Services | $19,682 | +14.9% |
| Real Estate & Rental & Leasing | $37,245 | +14.4% |
| Finance and Insurance | $67,379 | +14.0% |
| Admin. Support & Waste Mgmt. Svcs. | $34,372 | +13.3% |
| Total, All Industries | $52,221 | +11.8% |
| Health Care & Social Assistance | $57,421 | +11.1% |
| Information | $52,559 | +10.7% |
| Professional, Scientific, & Technical Svcs. | $71,825 | +10.3% |
| Public Administration | $58,500 | +9.1% |
| Other Services (except Public Admin.) | $31,135 | +8.2% |
| Manufacturing | $66,326 | +7.8% |
| Educational Services | $50,011 | +7.6% |
| Construction | $68,536 | +6.7% |
| Agriculture, Forestry, Fishing & Hunting | $42,484 | +6.4% |
| Transportation & Warehousing | $56,576 | +5.5% |
| Wholesale Trade | $65,923 | +5.4% |
| Utilities | $106,470 | +3.3% |
| Source: DEED QCEW | ||
From 2019 to 2021, the average wage for jobs in Northeast rose 11.8% (see Table 1). That growth, while robust, trailed the statewide growth of average wages (+12.5%) and was the second-lowest behind Southeast Minnesota. Interestingly, while the rise of prices accelerated beginning in 2021, average wage growth between 2020 and 2021 (+5.6%) in Northeast was slightly slower than from 2019 to 2020 (+5.9%). The sectors that saw the fastest growth in wages from 2019 to 2021 were Mining (+16.9%), Arts, Entertainment & Recreation (+16.4%), Management of Companies (+15.3%), Retail Trade (+15.0%), and Accommodation & Food Services (+14.9%). Retail, Arts, Entertainment & Recreation, and Accommodation & Food Services have below average wages and wage growth there is likely in response to the tightening labor market conditions.
Mining and Management of Companies, on the other hand, are two of the three highest paying sectors. The other highest-paying sector, Utilities, saw the slowest wage growth (+3.3%) over the past two years, followed by Wholesale Trade (+5.4%), Transportation & Warehousing (+5.5%), and Agriculture, Forestry, Fishing, & Hunting (6.4%). In general, these sectors didn't lose as many jobs, aren't adding as many jobs back, and as a result may not have felt the wage pressures as acutely as more service-oriented sectors.
The number of open jobs remains at historically high levels as of fourth quarter 2021. While the statewide total edged up from the previous record high in second quarter 2021 to over 214,000 in fourth quarter 2021, Northeast's total vacancies declined slightly compared to the summer season from 12,886 to 11,742. Despite this decrease, that was the second most vacancies on record and Northeast retained a higher-than-average vacancy rate of 8.9%. Only Northwest (9%) and Southwest Minnesota (9.9%) had higher shares of open positions relative to total filled jobs.
The median wage offer of $15.72 in the region was also the highest in the history of the 20-year series, but the lowest among all 6 planning regions. Southwest, with a median wage offer more than $0.50 greater, was the next lowest. From fourth quarter 2019, the median wage offer for open positions in Northeast rose $1.61 or 11.4%. That growth was slower than the 15.8% statewide increase and largely occurred over the most recent 6 months. Since second quarter 2021, $1.52 (+10.7%) was added to the median offer.
By pairing labor demand (job vacancies) with supply (number of unemployed) we can look at the tightness of the labor market. Before the pandemic in fourth quarter 2019, the ratio of job seekers to the number of job vacancies in the region was 0.9-to-1, meaning that even at that point there were fewer people looking for work than available jobs. The large number of layoffs at the beginning of the pandemic led to a spike in the number of unemployed and the job seeker-to-job vacancy ratio in second quarter 2020. However, in the two most recent survey rounds, the ratio has been below the previous record low seen in fourth quarter 2017 (0.7). The current ratio of 0.4 is the result of continued record high vacancies and record low unemployment. Looked at another way, there are 2.4 vacancies for each unemployed person.
At the industry level, Retail Trade had the most vacancies followed closely by Health Care & Social Assistance, the sector that had the most openings in the previous survey round. Those two sectors accounted for over half of all openings in the region.
Other Services, with nearly 2,000 vacancies had the third-most as well as the highest vacancy rate (50.5%). The high number of vacancies and high vacancy rates in service industries reflects both historical trends of higher turnover as well as the ongoing recovery in these sectors. At the other end are the production-oriented Mining and Manufacturing sectors. Both of these industries had vacancy rates below 1%, and the highest and 4th-highest wage offers, respectively.
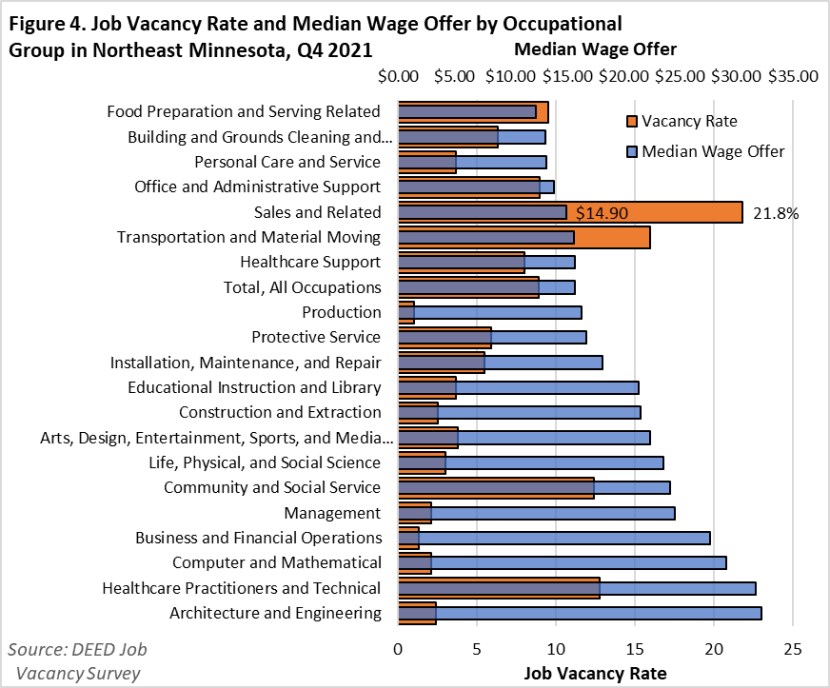
Occupational vacancies followed the same patterns, with even more consistent correlations between median wage offers and vacancy rates. In general, the occupational groups with the higher median wages had smaller vacancy rates and those with lower median wages were more likely to have higher vacancy rates (see Figure 4). This continues a trend where lower paying jobs are more difficult to fill, especially in a tight labor market.
Some notable exceptions to this trend are Healthcare Practitioners and Technical occupations and Community & Social Service occupations, each of which have higher than average vacancy rates and wage offers. Both groups faced enormous stress during the pandemic and may be facing some additional hiring challenges related to perception of those jobs.
Employers also must contend with the high barrier to entry for many Healthcare Practitioner and Technical occupations. The highest vacancy rates among individual occupations within the group were for Psychiatrists, Pediatricians, Pharmacists, Family Medicine Physicians, and Orthopedic Surgeons, all of which require advanced education and training. Driving the high vacancy rates in Community & Social Service are Substance Abuse, Behavioral Disorder & Mental Health Counselors, another occupation that requires specialized training and for which the need has increased over the last 2 years.
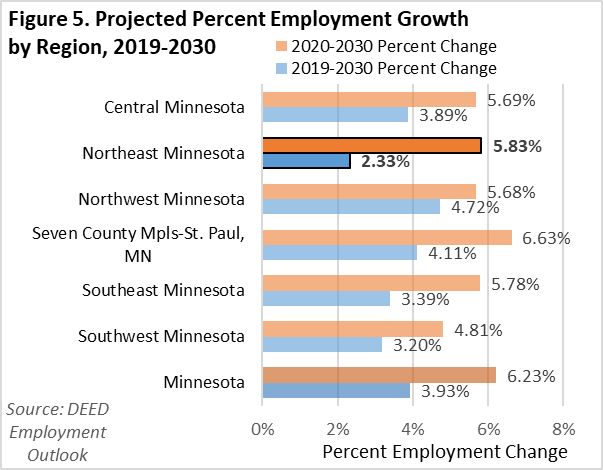
At first look, the projected ten-year employment growth for Northeast Minnesota appears in line or above other non-metro regions. Statewide employment was projected to grow 6.2% from 2020 to 2030, largely driven by growth in the most populous Metro region. After the Metro, Northeast had the highest projected percent employment growth at 5.8% (+8,100 jobs), edging out Southeast Minnesota for second place.
Long-term employment projections are conducted every two years for the subsequent decade. As a result of this schedule, the most recent round's base year fell on 2020, which showed the negative effects of the pandemic recession, an outlier from the long trend of employment growth across the state. However, as the region with the largest 2019-2020 relative employment loss, this coincidence appears to have had affected Northeast Minnesota's projections the greatest.
If we compare the 2030 projections to the 2019 actual levels, prior to any of the pandemic impacts, we get different results. The overall statewide percent growth falls from 6.2% to 3.9%, not including self-employment (see Figure 5). This makes sense as employment fell significantly from 2019 into 2020. Any growth over the longer term would have to first recoup the losses suffered in that one year. For that reason, Northeast's projected percent employment growth for the 2020-2030 period sees the largest increase when compared to the 2019-2030 period. Put more simply, Northeast has more employment to regain before it breaks even and then could see employment growth.
Some of the initial employment losses seen in 2020 also echo through employment projections by industry and occupation. Health Care & Social Assistance is predicted to have the largest number of added jobs in the region over the next decade with nearly 3,000. The rest of the top five are rounded out by Accommodation & Food Services (+2,400), Public Administration (+792), Arts, Entertainment, & Recreation (+784), and Other Services (+601). These five sectors combined to represent nearly four out of every five jobs projected to be added in the region by 2030.
However, of the five industries with the largest numeric job growth, three (Accommodation & Food Services, Arts, Entertainment & Recreation, and Other Services) can attribute their forecasted growth primarily to job recovery, as opposed to additional growth above and beyond pre-pandemic levels. Accommodation & Food Services' projected 20.5% growth rate and Arts, Entertainment & Recreation's 30% growth need to be taken in context with each sector's respective 2019-2020 percent employment losses of -22.4% and -25.6%.
In addition to Health Care & Social Assistance, Agriculture, Forestry, Fishing, & Hunting, Professional & Technical Services, and Public Administration also had projected growth surpassing recent percent employment losses. Those sectors are more likely to see new growth as opposed to recovery growth.
By occupation, many of the same trends can be seen. Other than the relatively small Farming, Fishing, & Forestry (+26.9%) occupational group, the fastest and largest growth is expected in Food Preparation & Serving (+17.1%), Healthcare Support (+12.5%), and Personal Care & Service (+11.5%) occupations.
Conversely, Sales & Related, Production, and Office & Administrative Support occupations are expected to see some long-term losses. The continued trends of increased automation, e-commerce, and the transition of work away from traditional office settings further accelerated by the pandemic likely are playing a role in these occupational groups' declines in the region.
Northeast Minnesota, while sharing in many of the labor market trends seen across the state over the last couple years, also stands apart in a few ways. First, the region faces a steeper recovery to return to pre-pandemic levels of employment. That recovery has been uneven partially due to labor force constraints. The labor force has fallen more sharply relative to other regions in the state, decreasing the supply of available workers. Sustained, record-levels of job vacancies indicate that despite the shortage of workers, demand remains high. The hope is that the hot, job seeker-friendly labor market conditions will convince more people to enter or re-join the labor force, benefiting workers and employers alike.