by Alessia Leibert
August 2018
American Indians have the lowest educational attainment rates of any population group in the United States, and Minnesota is no exception. Moreover, American Indians with a college degree have lower post-college earnings relative to other groups.
This study compares American Indian post-secondary students to their white peers with the aim of identifying (1) what educational and socio-economic characteristics set them apart from the majority race group, (2) how these background characteristics contribute to the observed employment and wage disparities relative to whites, (3) how geographic location, especially living and working in rural counties, negatively affects earnings, and (4) potential implications of the findings.
This research relies on post-secondary student records and Minnesota wage records from the Statewide Longitudinal Education Data System (SLEDS). Student records cover all for-credit public and private programs in Minnesota.
The dataset has 653,367 individuals ages 17 to 50 at the time of school exit who were either U.S. citizens or naturalized U.S. citizens and had an employment record in the state after leaving college. These selection criteria mitigate the risk of treating as dropouts students who left the state and continued their education elsewhere. Graduates who earned more than one degree were classified according to the highest degree obtained.
Employment and earnings outcomes are only for graduates who work in Minnesota as identified in administrative records of the state’s Unemployment Insurance program. Although 97 percent of Minnesota businesses report wages, people who are self-employed or employed out of state are not covered by Minnesota’s UI laws and are therefore not captured in our wage results.
This study is based on a very large dataset – 653,367 records – of students who enrolled in a post-secondary school in Minnesota from July 2006 to June 2016 and reported being either American Indian or white. Before delving into the data, it is important to clarify that the race definitions used in this study are based on self-reporting, and American Indians have a tendency to report their race inconsistently. Nearly 20 percent of American Indian students in our dataset reported being American Indian or white depending on the timing and context of data collection,1 indicating a mixed heritage and a fluid identification with both cultures. At one end of the spectrum are individuals who qualify as members of federally recognized tribes.2 At the other end of the spectrum are multi-race individuals with American Indian ancestors who predominantly identify as white. These inconsistencies were resolved by determining race based on frequency of responses.
American Indians have experienced significant progress in educational outcomes over the last decade. College attendance rates are on the rise, and the number of credentials awarded to American Indians nearly doubled from school years 2007-08 to 2014-15. But despite these gains, differences persist between American Indians and students of other racial/ethnic groups on key indicators of educational performance. As shown in Table 1, of 12,050 American Indian post-secondary students, 23.3 percent, nearly one in four, were high school dropouts, some of whom completed a General Educational Development (GED) credential. Such a high incidence, six times higher than whites at 4.2 percent, partly explains why American Indian students’ median age of enrollment was higher than whites, 24 versus 21. That is, white students tend to enter college straight after high school while American Indians are much more likely to delay entry, either because they don’t graduate from high school on time or for other reasons, such as inability to afford college without first finding a job.
| Table 1. High School and Post-Secondary School Characteristics 2000-2016 | |||||||
|---|---|---|---|---|---|---|---|
| Race* | Number of Students Enrolled from 2006 to 2016 | Women | With Permanent Residence Outside Minnesota** | Median Age at Enrollment | Percent Who Dropped Out of High School (including GED Completers) | Enrolled in a Post-Secondary School Outside the Twin Cities*** | |
| American Indian Alone or with other races except Hispanic/Latino | 12,050 | 59.1% | 8.8% | 24 | 23.3% | 60.9% | |
| White non-Hispanic | 641,317 | 55.6% | 11% | 21 | 4.2% | 49.8% | |
| * Mixed-race individuals who reported being American Indian in combination with Black, Asian, or Pacific Islander were excluded from the definition of American Indian in this analysis. Individuals who predominantly self-identified as American Indian and occasionally also reported being white or Latino, with Latino being a race category, not an ethnicity category, in our datasets, were for the most part included.
** International students who were not yet naturalized U.S. citizens at the time of enrollment were excluded. *** Includes three tribally run colleges and universities |
|||||||
| Source: Statewide Longitudinal Education Data System | |||||||
Racial differences in post-secondary educational outcomes are just as stark. Only 37.2 percent of American Indian college-goers earned a credential versus 64.9 percent of whites, meaning that two out of three white students made it to graduation while an almost identical share of American Indian students did not. Finally, 8.8 percent of American Indian students came from out of state, primarily Wisconsin and the Dakotas, and the majority (60.9 percent) enrolled in a post-secondary school located outside the Twin Cities Metro versus 49.8 percent of whites.
Although our dataset does not include measures of socio-economic status, we can infer this information from the characteristics of the high school that students attended. This information is available for entering undergraduate students from Minnesota, representing about 40 percent of our dataset. Of particular relevance is the percentage of students receiving free or reduced-price lunches, a commonly used indicator of school poverty. The results, displayed in Figure 1, reveal dramatic differences in socio-economic status.
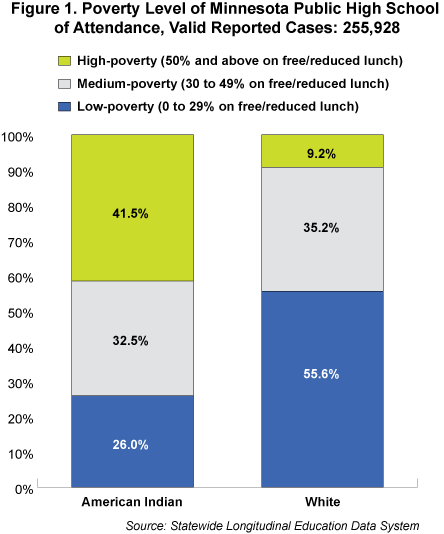
A staggering 41.5 percent of American Indian undergraduate students came from a high poverty secondary school – with all tribal schools falling into this category – compared to 9.2 percent among white students who were overwhelmingly more likely (55 percent) to have attended a low poverty high school.3
These socio-economic differences are not surprising given that, between 2012 and 2016, an estimated 31.4 percent of American Indians lived in poverty compared to 10.8 percent of the general population in Minnesota. 4
Despite the lack of information on the socio-economic characteristics of students attending private and out-of-state high schools, the large size of the dataset used for this analysis allows us to reach the conclusion that high school experiences, as well as the circumstances of entry into higher education, are considerably more challenging for American Indians than for whites. These disparities probably stem from the history of residential and socio-economic segregation experienced by American Indian communities in Minnesota.
Figure 2 provides further details of the striking gaps in post-secondary educational attainment between American Indian and white post-secondary students. As shown, 62.8 percent of American Indians did not earn a credential, compared to whites at 35 percent.
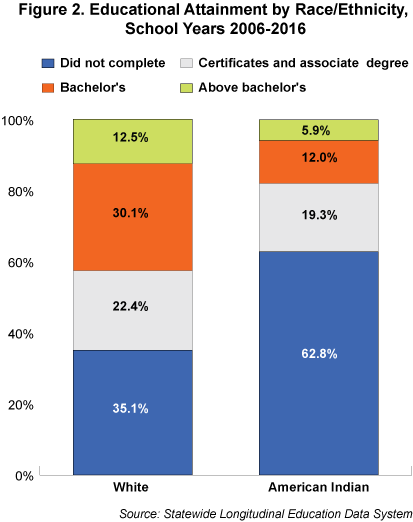
The high share of whites with a bachelor's degree, 30 percent, represents a large pipeline of people who can access master's and doctoral degrees. In comparison, the American Indian educational pipeline is much thinner. However, the presence of 5.9 percent advanced degree completers suggests that American Indians are a heterogeneous group that defies stereotypes. Low educational attainment is not necessarily representative of the American Indian experience.
What are the reasons for high college drop-out rates among American Indian students? A well-known risk indicator for dropping out is placement in remedial classes. Students are placed in supplemental instruction in core subjects like math and reading when they are unprepared to take college-level courses. American Indians are more likely than whites to be placed in educational remediation, 33 percent versus 18 percent. Addressing the problem of weak college readiness appears critical to improving American Indian students' chances of success in higher education.
Choice of major strongly determines the payoffs from higher education. Figure 3 displays the top 17 most popular majors for American Indian graduates and shows the share of white students in these same majors. The chart also distinguishes between sub-baccalaureate credentials (light bars) and bachelor's and above (dark bars). Despite similar shares of graduates at the top of the lists (health care, business, and education) the types of programs pursued by American Indians are of shorter duration than those pursued by whites. For example, 13.4 percent of whites earned a bachelor's or master's degree in business versus 8.7 percent of American Indians. These differences have significant implications for career outcomes, giving whites better chances of qualifying for higher paid business-related careers. Health care and education are other fields where degree level matters greatly to occupational outcomes. A bachelor's or higher credential is required to become licensed as a teacher, and over the last decade only 5.7 percent of American Indians earned these credentials versus 9.1 percent of whites. Also, a higher share of whites pursued health care programs that qualify for highly paid licensed occupations such as registered nurses, physical therapist, and radiation therapists.
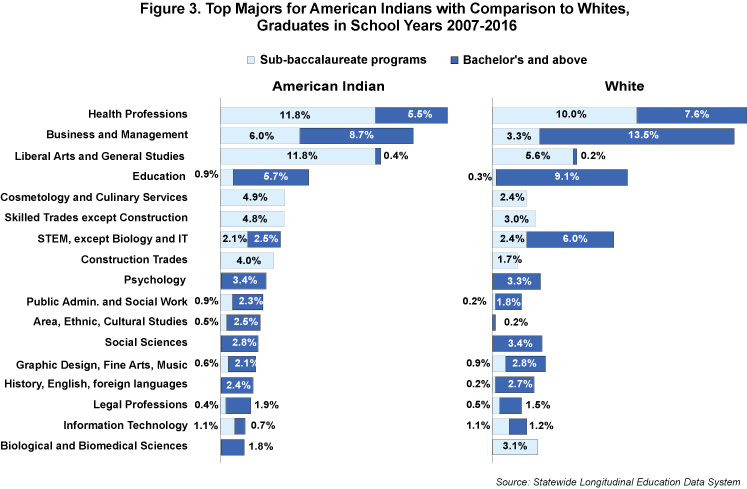
Differences by race in choice of major are evident on three important dimensions. First, American Indians were twice as likely to pursue a two-year degree in liberal arts as their highest degree compared to whites (12.2 versus 5.8 percent). This does not mean less interest in liberal arts among whites, but a greater probability for whites to continue on to a four-year degree in a non-liberal arts field, while most American Indians with a two-year liberal arts degree stop at that point. Second, American Indians are under-represented in STEM fields including biological and medical sciences, IT, engineering, math, architecture, and physical sciences. Altogether, 8 percent of American Indian graduates completed a STEM credential versus 14 percent of whites.5 As a consequence, American Indians are under-represented in the medical field and in high-tech industries such as Professional and Technical Services and Advanced Manufacturing.6 Third, American Indians are over-represented in short-term programs such as culinary arts and cosmetology, which generally lead to low-paying occupations.
As a result of these differences, both in terms of major and degree level completed, American Indians have lower chances of entering licensed and high-paid careers than whites. Furthermore, American Indians were more than twice as likely as whites (21 versus 9 percent) to enroll at two-year for-profit institutions that cater predominantly to low-income students but generally did not produce good outcomes, both in terms of completion rates and in terms of earnings.
These results also highlight a few bright spots. First is the strong presence of American Indians in construction programs, which are less than four years in length and offer well paid, stable jobs.7 The second is the cultural relevance of many majors pursued by American Indians. Ethnic studies, social work, public administration, law enforcement, and legal studies are evidently appealing to American Indian students, leading to careers in cultural preservation, tribal government, and legal/social services where they can make a difference in the American Indian community.
However, there is also some evidence of American Indians aspiring toward other educational paths and facing barriers to completion. For example, rates of completion of registered nursing programs were 57 percent versus 81 percent among whites. Similarly, in the field of education the rates of completion were 58 percent among American Indians and 77 percent among whites. American Indians' completion rates in registered nursing and education have improved over the last five years, signaling some progress in academic preparation and outcomes, but still lag behind those of whites.
The most consequential gap between American Indian students and their white peers as they transition from school into the labor market is in the ability to find a job. As shown in Table 2, 28.6 percent of American Indians did not have an employment record in the second year after school exit compared to 20.8 percent among whites. This is the largest employment gap observed in any racial group among Minnesota's post-secondary students. This measure is not equivalent to joblessness. Some people might hold jobs not captured by Minnesota wage records, especially self-employment. It is likely that some individuals on reservations were self-employed in activities like construction, repair, or family farming, and therefore were not found in wage records. However, the high concentration of American Indians in this category casts light on the challenges facing American Indians in the labor market. To determine how much of this result is influenced by the economic cycle, Table 2 breaks down the figures into three smaller time snapshots: pre-recession, recession, and full economic recovery.
| Table 2. Employment Status of Individuals Who Exited School Between the Ages of 17 and 45 by Race/Ethnicity | ||||
|---|---|---|---|---|
| Year of School Exit | Number of Students Aged <=45 at the Time of School Exit | % Employed in Minnesota During 2nd Year | Not Found in Minnesota Employment Records* | |
| American Indian | Total 2006-2016 | 10,453 | 71.4% | 28.6% |
| Exited Before the Recession (2007) | 1,229 | 75.9% | 24.1% | |
| Exited During Recession (2008-09) | 2,107 | 66.6% | 33.4% | |
| Exited During Full Recovery (2013-15) | 3,448 | 75.0% | 25.0% | |
| White | Total 2006-2016 | 614,078 | 79.2% | 20.8% |
| Exited Before the Recession (2007) | 90,942 | 80.1% | 19.9% | |
| Exited During Recession (2008-09) | 118,007 | 76.6% | 23.4% | |
| Exited During Full Recovery (2013-15) | 202,443 | 80.9% | 19.9% | |
| * People employed by federal agencies, self-employed, or employed in other states are not represented in Minnesota wage records. Therefore, not having an employment record in Minnesota does not necessarily mean being without a job. Despite these caveats, the trends in this table are consistent with American Community Survey statistics showing that the unemployment rate among American Indians was highest in 2010 at 19.4 and continues to be the highest of any racial group in 2016 at 12.8 percent (see 2016 and 2010 American Community Survey 1-Year Estimates, Minnesota). | ||||
| Source: Statewide Longitudinal Education Data System | ||||
During the Great Recession significantly fewer American Indians found jobs after college than their white peers (66.6 versus 76.6 percent). American Indians were hit particularly hard by the collapse of the timber industry which affected Logging, Construction, and Furniture Manufacturing. They are in general more vulnerable to job losses during economic downturns because of low educational attainment. Since the 2013-2015 economic recovery American Indians' employment rate returned to pre-recession levels but still lags behind that of whites (80.9 percent).
Besides being influenced by the economic cycle, these employment disparities are also driven by socio-economic status. Figure 4 examines the relationship between school poverty, post-secondary completion rates, and the lack of employment records. School poverty is measured in three categories just as in Figure 1: low, medium, and high poverty based on the percentage of students eligible for free or reduced-price lunch. The chart also displays results for GED completers as a separate category to give an idea of the devastating effect that not finishing high school on time can have on educational attainment and job prospects.
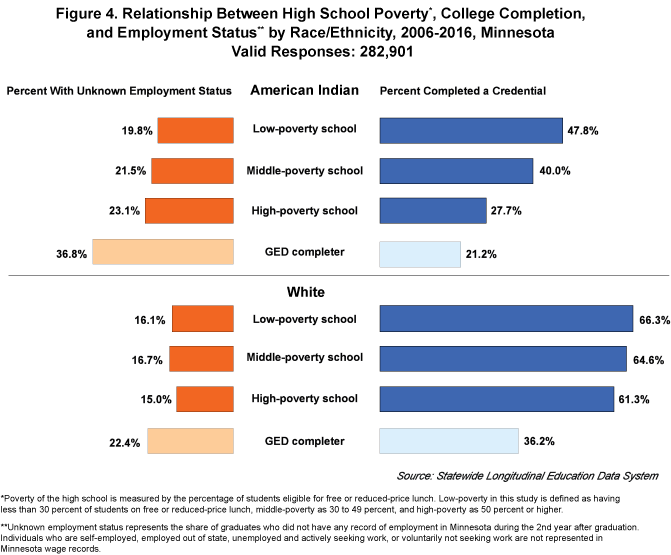
Among American Indians, school poverty has a negative effect on both completion rates and employability prospects. Credential completion rates were almost twice as high among American Indians attending low-poverty schools as among those attending high-poverty schools (47.8 percent versus 27.7 percent), and the risk of not finding work was lower for those attending low-poverty schools, 19.8 percent, and higher for those attending high-poverty schools at 23.1 percent.
Interestingly, school poverty does not appear to have an impact on employability prospects among whites. The incidence of unknown employment status was 16 percent for whites who attended a low-poverty school, 16.7 percent for those who attended a middle-poverty school, and 15 percent for those who attended a high-poverty school. The non-linearity of the relationship suggests that among whites, differences in school poverty are not strong enough to impact employability. It is also important to recall that the group of white students in high-poverty schools makes up only 9 percent of the white population for whom these data are available.
The effects of dropping out of high school and earning a GED were also more pronounced for American Indians than for whites: 36.8 percent of American Indian GED holders had no employment records in Minnesota the second year after graduation and only 21.2 percent of them completed a credential. In contrast, white GED holders were more likely to earn a credential (36.2 percent) and had less difficulties finding work.
There are multiple possible reasons for stronger effects among American Indian. For example, high poverty schools in American Indians communities may experience deeper poverty than those in predominantly white communities. Second, in high-poverty schools, it may be that American Indian students are more likely to be the ones eligible for free/reduced price lunch, while whites might attend a high-poverty school without their family being in poverty. Third, the types of public high schools attended by American Indians are likely to differ from those attended by whites in other educationally relevant dimensions besides poverty, such as size, remoteness, governance, funding streams, or attractiveness to talented teachers.
Regardless of the reasons for these differences, a key takeaway from this analysis is that American Indians who attended low-poverty high schools fared significantly better, especially in terms of college graduation rates. The worrisome fact is that high-poverty schools are often the norm for American Indian children in Minnesota (see Figure 1). This childhood disadvantage hurts their chances of earning a post-secondary credential and of finding employment, which in turn results in more poverty in their communities and schools. This is, in over-simplified terms, the vicious cycle that can entrench generations of American Indians in poverty.
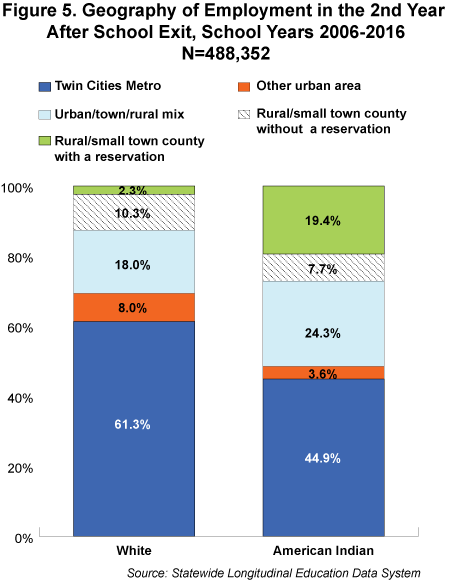
As shown in Figure 5, a minority of American Indians (44.9 percent) worked in the Twin Cities versus 61.3 percent of whites. Only 12.6 percent of whites were employed in rural areas of the state, broken down into 2.3 percent in rural counties containing reservation boundaries and 10.3 percent in counties not containing reservation boundaries. In contrast, one out of five or 19.4 percent of American Indians were employed in rural counties containing reservation boundaries: Beltrami, Cass, Clearwater, Cook, Hubbard, Itasca, Koochiching, Mahnomen, and Yellow Medicine.8 The types of jobs held by these individuals are very different from those held by American Indians in the Metro. As shown in Figure 6, only 42.2 percent of American Indians in rural counties were employed in private sector jobs. The majority held public sector jobs, primarily in the Local Government of their tribe (22 percent), followed by casino-related activities, Education, Social Assistance, Health Care, and Public Administration. In contrast, only 19 percent of whites employed in rural areas held public sector jobs.
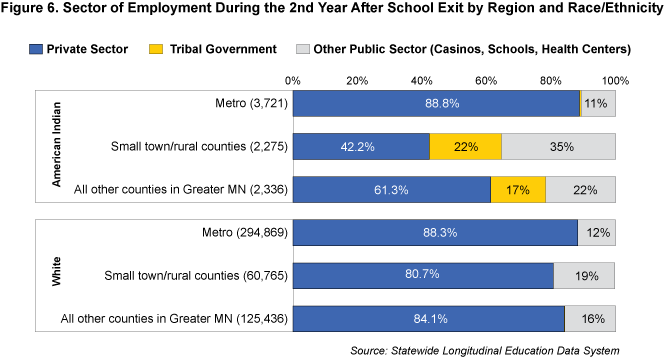
It is important to point out that American Indians employed in the Metro were just as likely as whites to hold private-sector jobs (88 percent). American Indian's above-average reliance on public sector jobs is predominantly a rural phenomenon. A large percentage of American Indians in Minnesota identify with tribes controlling remote reservations in sparsely populated northern areas where high-paying private-sector jobs are scarce.
The high concentration of public sector employment in these reservation communities represents both a weakness and a strength. On the one hand, it reflects a key challenge facing rural reservations: a relative scarcity of private sector employers and small-business ownership that hampers the development of diversified economies.9 On the other hand, participation in the tribe's economy enables American Indians to maintain sizeable reservation communities that affirm their traditions and cultural values, which are also important measures of success. Furthermore, even if we were to measure success through earnings, the wages earned in the public sector in rural counties by both American Indians and whites are higher than those earned in the private-sector. American Indians who wish to live close to their community may not have much to gain from taking jobs outside the reservation at wages that cannot even cover the cost of transportation and/or child care. Good quality private sector jobs are sorely needed in rural Minnesota, and this economic development challenge disproportionally affects American Indian communities.
In the second year after leaving school, American Indian student median hourly wages earned were already lower than their white peers. Table 3 presents these findings by age group and education level, distinguishing between non-completers, completers of credentials through bachelor's, and completers of advanced degrees. Without accounting for educational differences, the median hourly wage for the youngest cohorts of American Indians, $13.29, represented 78 percent of the median hourly wage of whites of the same age group ($16.97). That is, the racial wage gap is 22 percent. Accounting for education level shows a substantial reduction in the gap. The reduction is slightly more pronounced for undergraduate credential completers (earnings ratio of 90 percent) than for advanced degree completers (earnings ratio 87 percent) meaning that white advanced degree holders tend to have access to higher paid jobs than equally qualified American Indians.
| Table 3. Wages by Education Level, Age, and Race/Ethnicity | |||||||||
|---|---|---|---|---|---|---|---|---|---|
| Total | Non-Completers | Completers through Bachelor's | Completers of Advanced Degrees | ||||||
| Race | Number of Students | Hourly Median Wage | Earnings Ratio | Hourly Median Wage | Earnings Ratio | Hourly Median Wage | Earnings Ratio | Hourly Median Wage | Earnings Ratio |
| Age at School Exit 18-30, Statewide | |||||||||
| White | 369,775 | $16.97 | 100% | $13.94 | 100% | $17.60 | 100% | $30.44 | 100% |
| American Indian | 5,466 | $13.29 | 78% | $11.88 | 85% | $15.82 | 90% | $26.61 | 87% |
| Age at School Exit 31-45, Statewide | |||||||||
| White | 102,214 | $25.10 | 100% | $21.01 | 100% | $22.18 | 100% | $39.40 | 100% |
| American Indian | 2,556 | $16.89 | 67% | $14.85 | 71% | $17.80 | 80% | $31.47 | 80% |
| All wages are inflation-adjusted and standardized to 2017 U.S. dollars. | |||||||||
| Source: Statewide Longitudinal Education Data System | |||||||||
Wage gaps by race are substantially more pronounced among older students. Overall, the earnings ratio is 67 percent corresponding to a gap of 33 percent. Completing a credential, whether at the undergraduate or graduate level, increases the earnings ratio from 67 to 80 percent, meaning that educational attainment can bridge some of the gap also at an older age but wage disadvantages accumulated in the labor market are already too large to achieve the kind of improvement we see among young cohorts. This evidence demonstrates that completion of a college credential reduces racial wage disparities, but not enough to eliminate them altogether, and investments in higher education are most effective before age 30.
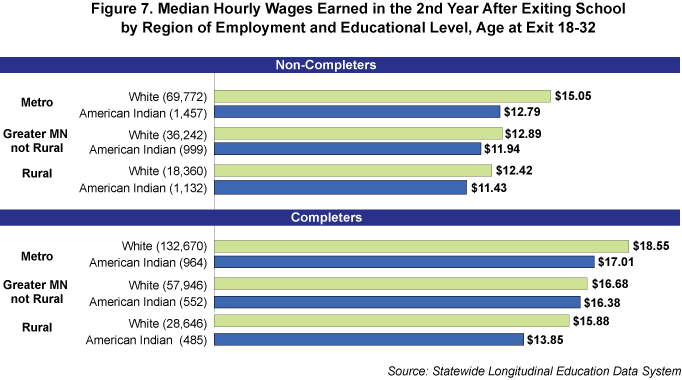
To examine whether differences in geographic location play a role in explaining wage gaps we created three geographic categories: (1) Twin Cities Metro, (2) rural counties, (3) all other non-rural counties in Greater Minnesota.10 Earnings results are displayed in Figure 7. Controlling for geography reduces gaps but does not eliminate them. Wages were highest in the Metro area and lowest in rural areas, but whites earned more in every geography. Among non-completers, whites in the Metro earned $15.05 and American Indians earned $12.79, a gap of 15 percent; whites in rural areas earned $12.42 while American Indians earned $11.43. Among completers we see substantially more equitable outcomes except in rural areas. In the Metro, whites earned $18.55 and American Indians earned $17.01, a gap of 8.4 percent, which is one of the smallest observed in this study. In non-rural areas of Greater Minnesota American Indians earned a wage of $16.38, closely trailing the $16.68 earned by whites. The only place where credential completion did not help reduce gaps was rural Minnesota, where American Indians earned only $13.85 relative to $15.88 among whites, a gap of 12.7 percent.
Let's now zoom into the rural area category to explore whether proximity to a reservation11 makes a difference in earnings outcomes (see Figure 8). Among non-completers, American Indians in rural areas actually earned more near a reservation than further away, $11.66 compared to $11.15. This raises the possibility that reservation jobs are the best available option in rural areas for American Indians without a college credential. American Indians even slightly out-earned whites in reservation areas, although very few whites were found in that geography.
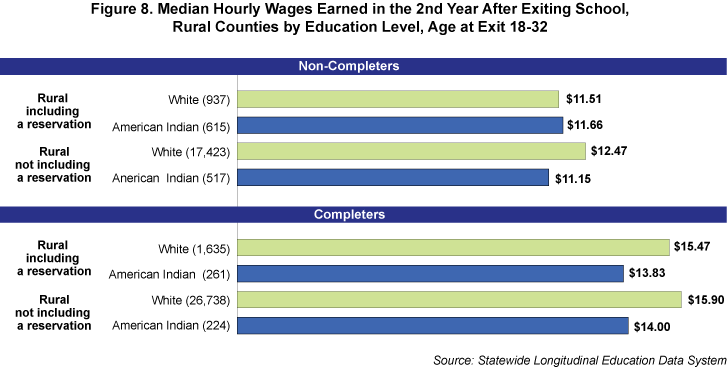
Among completers, American Indians near reservations earned slightly lower wages than those further away ($13.83 compared to $14.00) but not to the point of offering incentives to move or commute elsewhere for work. White graduates had higher earnings both in proximity to reservations and further away. The reasons for the persisting gaps are partially educational: whites are more likely to hold bachelor's degrees. However, differences in education do not entirely explain these disparities.
The fact that white non-completers found high quality jobs despite the lack of a credential while American Indian non-completers did not points to the possibility of racial discrimination in the labor market. Are white students better connected to the job market so that they were able to land good jobs even without formal credentials? Are American Indians less likely to enter industries that offer opportunities for on-the-job training and career advancement? Do employers discriminate in recruiting and hiring based on race? All of these potential factors could cause inequality in opportunities to develop valuable skills and work experience regardless of education level.
These results have two important policy implications. First, the characteristics of local economies surrounding reservations play a large role in driving statewide wage disparities between American Indians and other race groups. Policies aimed at mitigating the rural/urban divide, for example through infrastructure investments, would help American Indians access a wider range of job opportunities. Second, American Indians experience lower returns on their post-secondary education investments and might take longer to repay student loans especially in rural areas. Targeted initiatives such as grants, scholarships, and loan relief programs might be needed to increase American Indians' incentive to invest in education.
For deeply rooted historical reasons, American Indians are the poorest population group in the nation. They have also been damaged by abysmally flawed federal educational policies that have emphasized either excessive segregation or excessive assimilation. American Indian communities must strike a delicate balance between reclaiming their cultural identity and integrating into the sectors of the Minnesota economy that offer the most labor market success. Because these are difficult goals to reconcile, it is important to support young adults as they transition from high school into higher education and into the workforce.
This study has documented various challenges faced by American Indians in these transitions. Here is a summary of findings:
Higher education is not necessarily the answer to improving the economic conditions of low-income American Indians, but as the group with the least access to higher education financially, geographically, and academically, they are vulnerable to hiring bias and career advancement bias in the labor market. Missing the chance to complete some kind of post-secondary education, even a vocational certificate, decreases their economic leverage in an era when qualification inflation gives employers the ability to use credentials as a screening mechanism.
Any progress we as a society can make toward filling educational achievement gaps among all population groups but particularly for American Indians can reduce the role of racial bias by giving employers skills benchmarks based on objective qualifications. Last but not least, policies aimed at mitigating the rural/urban economic divide in Minnesota would go a long way toward promoting economic mobility and could change the lives of low-income American Indians.
1Since data collection forms do not allow students to check more than one race category, a person of mixed white/American Indian race might report one race at the time of enrollment and a different race at the time of graduation.
2As sovereign nations, tribal governments define the criteria for membership or citizenship as well as the membership enrollment process.
3Low-poverty in this study is defined as having less than 30 percent of students eligible for free or reduced-price lunch. Although the socio-economic characteristics of a school as a whole do not necessarily represent individual student characteristics nor school quality, schools in low-income communities tend to have fewer resources than those serving predominantly wealthy communities, Differences in the education and/or income level of parents also influence learning experiences.
4Source: American Community Survey 5-year Estimates 2012-2016, Poverty Status in the Past 12 Months, Minnesota
5Furthermore, the STEM degrees awarded to American Indians were more skewed towards forestry/natural resource conservation and production technicians programs and less towards engineering, biomedical, and hard sciences.
6For detailed information on industries of employment in Minnesota by race see the Graduate Outcomes Dashboard
7Differences in choice of major relative to whites do not appear attributable to differences in the gender composition, because females make up about 60 percent of graduates both among whites and among American Indians.
8The other four Minnesota counties containing reservations - Becker, Carlton, Goodhue, and St. Louis - are not classified as small town/rural.
9These characteristics of employer establishments in reservations have also been observed in Akee, Mykerezi, Todd (2018) Reservation Nonemployer and Employer Establishments: Data from U.S. Census Longitudinal Business Databases
10This category includes Metropolitan Statistical Areas and counties classified as urban/town/rural mix. We did not break down non-rural areas into reservation/non reservation employment because non-rural reservations are very small and small datasets yield volatile results.
11Proximity to a reservation in this study does not mean residing in a county with a reservation. It means being employed in a sub-county area including tribal lands. In rural areas these tribal lands are White Earth, Leech Lake, Bois Forte, Red Lake, and Grand Portage (all Anishinaabe/Ojibwe) as well as the Upper and Lower Sioux reservations. We also included the township of Bemidji.