by Cameron Macht
June 2020
The coronavirus pandemic that spread across the nation and state in March and April of 2020 put a halt to the longest running economic expansion in recent history. Statewide, more than 660,000 workers had filed applications for Unemployment Insurance (UI) in Minnesota from March 16 to May 16, with specific demographics, geographies and industries more affected than others. To put the recent economic events into context, DEED has provided a set of articles explaining the impact in each region.
Between March 16 and May 16, almost 35,500 workers had filed applications for Unemployment Insurance (UI) in the 23-county Southwest Minnesota planning region. While these were historic high numbers of UI applications, the region actually showed the smallest impact from layoffs of the six planning regions in the state. Through May 17, 16.4% of the total labor force in Southwest Minnesota had applied for UI, compared to 21.6% of the state's labor force overall.
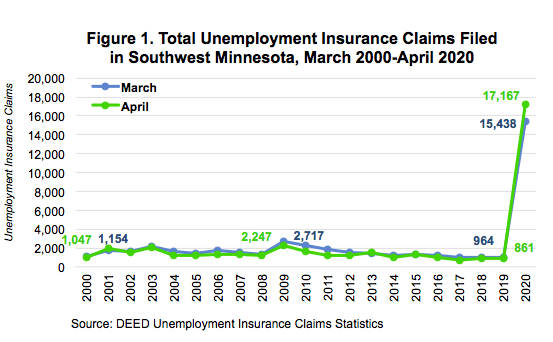
Despite seeing the smallest impact among Minnesota's six regions, it was still an absolute unemployment explosion. For context during the peak of the Great Recession, just under 5,000 people filed claims in March and April 2009. In March and April of 2019, there were a total of just 1,825 initial UI claims in Southwest Minnesota. This means we've seen a 550% increase in UI applications during March and April 2020 vs. March and April 2009, and a 1700% increase versus those same months in 2019.
The number of claims filed in March and April combined was more than the total number filed in every calendar year except for 2009, at the height of the Great Recession. Over the past three years, from 2017 to 2019, Southwest Minnesota averaged just 15,200 claims for the entire year, which was outpaced just in the month of March this year. This spike in claims is completely unprecedented – the region has simply never seen anything like it (see Figure 1).

Another key difference between our current crisis and previous years that is revealed in UI applications is in the age, race, and gender of those most impacted. In last year's tight labor market environment, just 18.5% of claims were filed by people under age 30 as employers scooped up entry-level talent; in March 2020, 32.2% of claims were filed by people under 30, who, as likely the "last in", were often the first ones back out the door. Since Minnesota's economy has been expanding and adding jobs since the end of the Great Recession in 2009, the sudden job loss is something most of these teenagers and young adults have not had to deal with in the labor market before. As the economy recovers, it will be useful to track how these young workers bounce back.
While white people made up 93.3% of the labor force in the region, they accounted for just 83.5% of UI applications through May 16. This means that layoff activity has been more concentrated among People of Color within the region, and for two groups in particular. Nearly one-third of Black or African American and American Indian workers have applied for unemployment – more than double the rate for whites. Likewise, about one in every five Asian or Pacific Islanders and workers of Hispanic or Latino origin submitted a UI application through May 16 (see Table 1). The adverse employment impacts on People of Color could deepen the economic disparities already present in the region.
Table 1. Southwest Minnesota Unemployment Insurance Applicants by Race, Mar. 16-May 16
| Race | Cumulative UI Applications Through May 16 | Share of UI Applications | Total Labor Force | Share of Total Labor Force | UI Applications as a Share of Total Labor Force |
|---|---|---|---|---|---|
| White Alone | 29,596 | 83.5% | 198,532 | 93.3% | 14.9% |
| Black or African American | 1,174 | 3.3% | 3,608 | 1.7% | 32.5% |
| American Indian/Alaska Native | 361 | 1.0% | 1,111 | 0.5% | 32.5% |
| Asian or Pacific Islanders | 753 | 2.1% | 3,621 | 1.7% | 20.8% |
| Some Other Race and Two or More Races | 508 | 1.4% | 5,821 | 2.7% | 8.7% |
| Choose not to answer | 939 | 2.6% | N/A | N/A | N/A |
| Hispanic or Latino | 2,126 | 6.0% | 12,330 | 5.8% | 17.2% |
| Total | 34,518 | 100.0% | 212,693 | 100.0% | 16.2% |
| Source: DEED Unemployment Insurance Statistics, 2014-2018 American Community Survey 5-Year Estimates | |||||
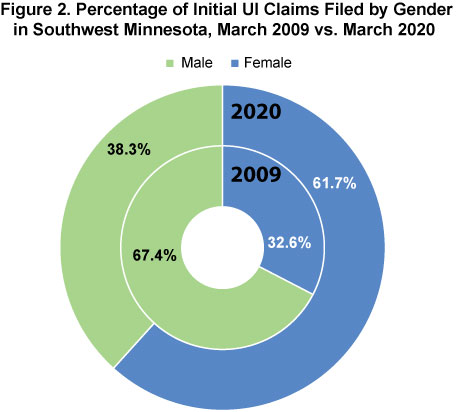
We see another demographic difference in the gender of those most impacted. In 2009 and 2019, only about one-third of UI claims in the region were filed by females; whereas in March 2020, nearly 62% of laid off workers were female (see Figure 2). In most years, male-dominated construction and production occupations typically lead the way in claims activity, accounting for around half of UI applications in March and April. However, these categories made up just 16% of claims in March and April of 2020.

The data clearly show that young workers, People of Color and females are much more likely to be working in the industries and occupations that have been most directly impacted during the current crisis. In March 2020,food preparation and serving workers filed 21% of claims, which was five times more than in 2009; and another 17.4% of claims were filed by sales and office workers, which was double the percent of claims filed during the Great Recession. These are heavily female-dominated occupations, as are the personal appearance, information clerks, and health care occupations that round out the top 10 list for UI applications in Southwest Minnesota (see Table 2).
Table 2. Unemployment Insurance Applications by Occupation Group in Southwest Minnesota
| SOC Code | SOC Occupational Title | UI Claims Filed 3/16-5/16 2020 |
|---|---|---|
| 353 | Food & Beverage Serving Workers | 2,863 |
| 412 | Retail Sales Workers | 2,054 |
| 472 | Construction Trades Workers | 2,035 |
| 519 | Other Production Occupations | 1,749 |
| 352 | Cooks & Food Preparation Workers | 1,569 |
| 319 | Other Healthcare Support Occupations | 1,328 |
| 395 | Personal Appearance Workers | 1,185 |
| 434 | Information & Record Clerks | 1,173 |
| 292 | Health Technologists & Technicians | 1,120 |
| 291 | Health Diagnosing & Treating Practitioners | 1,037 |
| Source: DEED Unemployment Insurance Claims Statistics | ||
Though the regional employment estimates don't include self-employed workers, who were urged to apply for UI if they were impacted by COVID-19 slowdowns because of an emergency measure that made them eligible for benefits, comparing the number of UI claims filed to the total number of workers in those occupations in the region show some shocking concentrations. Data suggest that a majority of employees in the region's healthcare support occupations – which includes medical assistants, dental assistants, medical transcriptionists, pharmacy aides, and massage therapists among others – have filed for unemployment benefits after having either temporarily lost their jobs or seeing their hours cut.
Likewise, higher-level health diagnosing and treating practitioners – such as RNs, pharmacists, veterinarians, dentists, and chiropractors – and health technologists and technicians – including LPNs, medical lab techs, pharmacy technicians, EMTs, dental hygienists, and veterinary technicians – also saw job losses that have never been experienced in the industry.
More than 40% of the region's cooks and food preparation workers and 25% of the food and beverage serving workers saw a disruption in their work as restaurants and bars shut down on-site service across the region. Almost 20% of retail sales workers – ranging from cashiers to salespeople – were at least temporarily laid off from their stores. But the biggest cuts were suffered by personal appearance workers – most notably barbers and hairdressers, hairstylists, and cosmetologists – which saw nearly 1,200 applications for benefits from the middle of March through mid-May, primarily from self-employed workers who qualified for unemployment benefits under the emergency federal Pandemic Unemployment Assistance program.
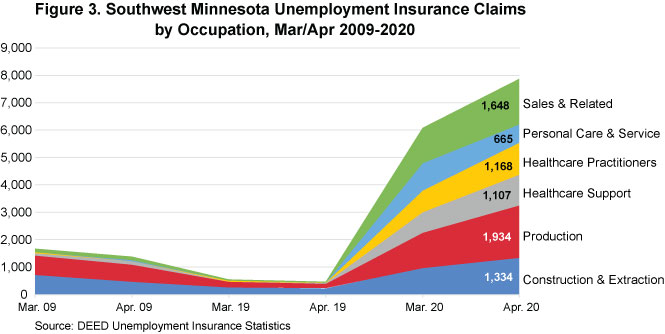
In comparison to past years, Southwest Minnesota is seeing relatively small shares of UI applications from production workers, especially those in the region's major manufacturing sectors like food manufacturing, machinery manufacturing, and printing. Both food processing workers and printing workers were averaging less than 45 claims per week, while metal workers and assemblers and fabricators both averaged less than 70 claims per week. While those numbers are historically high, the increase pales in comparison to the jump experienced in food preparation, sales and related, personal care and service, and health care occupations (see Figure 3).

Manufacturing is still the second largest employing industry in Southwest Minnesota, accounting for almost 18% of total jobs – easily the highest share of the six planning regions in the state. Southwest also has the largest share of agriculture employment in the state, and the largest concentration of crop and livestock farms of any region. These closely-related industries have built a strong supply chain in the region that also stretches into wholesale trade, transportation and warehousing, finance and insurance and real estate.
Though many of these new UI claims are expected to be temporary, there is no doubt that some will end up becoming permanent. The region's unique industry mix and tightly-bonded supply chain will allow industries and employers to rely on one another for support during these challenging times, and may even lead to new connections, methods of production and delivery, and opportunities for growth. This will also require a crop of ready, willing and able workers with the skills to function in a new environment.