by Dave Senf
July 2016
Note: All data except for Minnesota’s PMI have been seasonally adjusted. See the feature article in the Minnesota Employment Review, May 2010, for more information on the Minnesota Index.
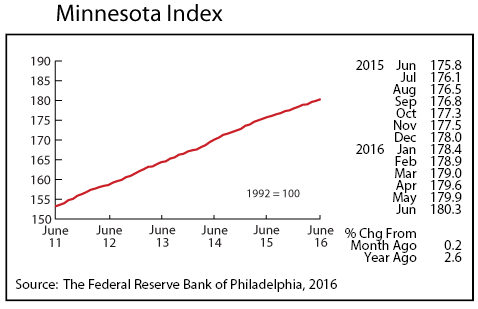
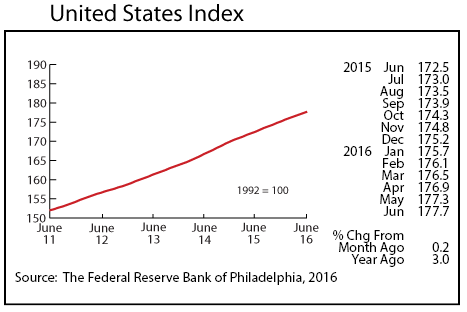
The Minnesota Index advanced 0.2 percent for the second consecutive month in June. Wage and salary employment increased as did average weekly manufacturing hours and real wage and salary disbursements. Seasonally adjusted unemployment remained unchanged at 3.8 percent for the third straight month. The U.S. Index increased by 0.2 for the sixth month in a row in June.
Minnesota’s index is up 1.3 percent through the first six months of 2016 which is down from 1.9 percent during the first half of last year. The U.S. index increased 1.4 percent through the first half of 2016 compared to 1.8 percent during the first six months of 2015. Both indices are estimates of monthly GDP or economic activity. Last year both Minnesota and the U.S. had real GDP growth of 2.4 percent. Minnesota’s average annual GDP growth over the last five years was 2.2 percent compared to 1.8 percent nationally. Average annual GDP growth for neighboring states over the same period range from North Dakota (7.8 percent), Iowa (2.1), and South Dakota (1.9) to Wisconsin (1.7).
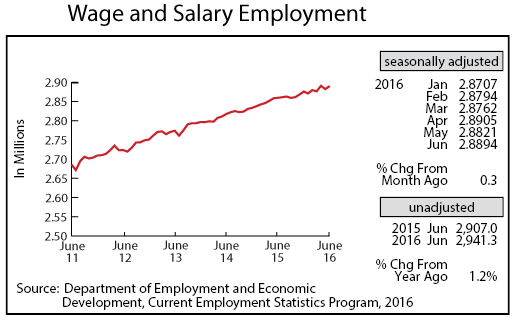
Since the beginning of the year, adjusted Wage and Salary Employment has zigzagged, declining in odd months and increasing in even months. June’s job gain was 7,300, offsetting most of the 8,400 jobs lost in May. Private sector hiring accounted for 5,800 new jobs last month, while public sector payrolls increased by 1,500. Private hiring was up the most in Leisure and Hospitality, Educational and Health Services, Construction, and Other Services. Job loss was heavy in Trade, Transportation, and Utilities.
Minnesota’s unadjusted over-the-year job growth jumped to 1.2 percent in June compared to 1.8 percent nationwide. Minnesota’s job growth has trailed U.S. job growth for over two years now. Minnesota job growth averaged 1.2 percent over the first half of 2016 which is down from the 1.6 percent averaged during the first six months of the previous five years, 2011 – 2015.
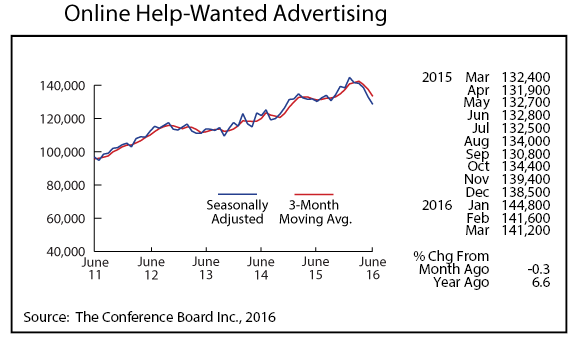
Online Help-Wanted Ads in the state slipped for the fifth consecutive month in June, dropping 3.3 percent. Ads also dropped nationally, falling 4.6 percent. Help-wanted ads are down 11.2 percent since peaking in January in Minnesota and down 16.1 percent nationally since peaking last November. Other measures of job openings, however, have not shown the same downward trend online job advertising has, suggesting that labor demand may not be waning as suggested by falling online help-wanted levels.
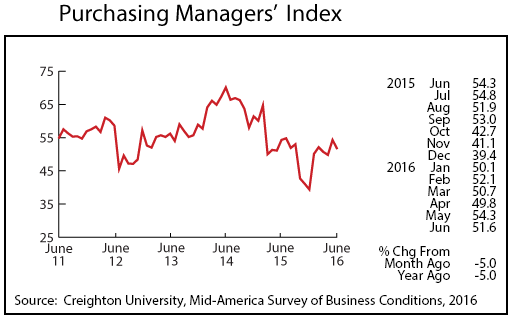
Minnesota’s Purchasing Managers’ Index (PMI), after advancing in May, lost ground in June, tailing off to 51.6. Minnesota’s reading topped the nine-state Mid-America Business Condition Index (50.1) but fell below the 53.2 reading for national manufacturing. The U.S. reading was the highest since last February, suggesting that U.S. manufacturing activity will be accelerating over the second half of the year. Minnesota’s manufacturing sector appears to be a step behind.
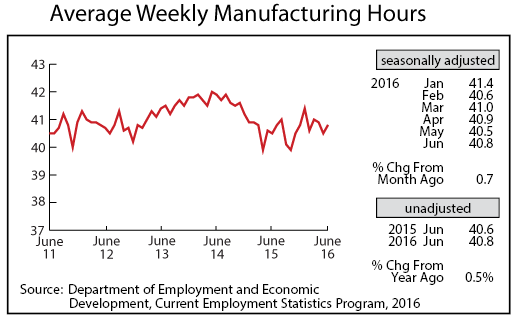
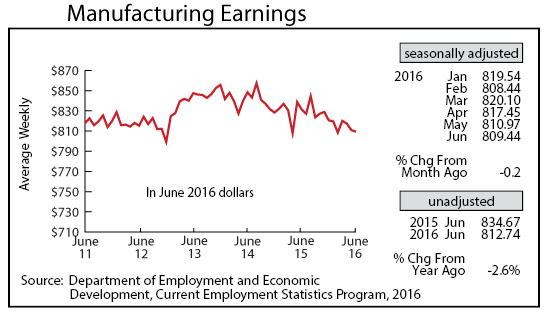
Adjusted Manufacturing Hours jumped to 40.8 hours in June and are up compared to a year ago but still remain way below the record level reached two years ago. Factory workweeks for the first half of 2016 have average 40.9 hours compared to 40.6 hours last year and 41.6 in 2014. Average weekly Manufacturing Earnings were lower for the third month in a row, declining to $809.44. In real terms that is a 2.6 percent drop from a year ago.
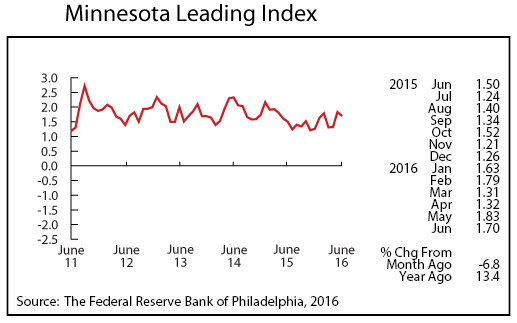
The Minnesota Leading Index, which is designed to predict the six-month change in the Minnesota Index fell slightly in June to 1.7. Since the Minnesota Index is a proxy measure of Minnesota’s GDP, the Minnesota Leading Index is really predicting the six-month growth in the state’s economic activity or GDP. June’s 1.7 reading suggests continued economic growth in Minnesota through the rest of the year.
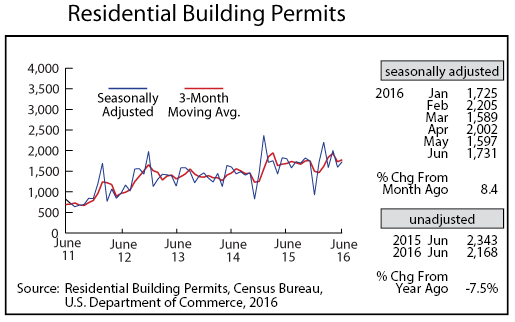
Adjusted Residential Building Permits skipped upwards slightly in June to 1,731. Permit numbers through the first half of the year are roughly the same as last year, however, despite an acceleration in home buying and home prices. Home-building activity will likely pick up if the current pace of home buying continues, but as of now home-building activity is still roughly 20 percent below the historical norm.
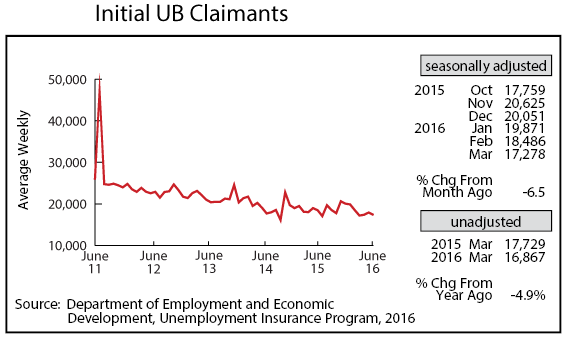
Adjusted Initial Claims for Unemployment Benefits (UB) dipped slightly to 17,355 in June, continuing its long-term trend downwards. Claims for this year are likely to be lower than last year for the seventh year in a row. The ratio of total initial claims, a proxy for layoffs, to total wage and salary employment is .625. The ratio hasn’t been this low since 2000.
