by Michael Darger and Cameron Macht
March 2019
Barnesville and Cottage Grove craft the local Business Retention and Expansion playbook.
Trying to attract businesses from outside the community or launching startup businesses often come to mind as key activities for economic development. However, economic development thought leaders generally agree that the most practical strategy for growth is keeping the businesses that are already established in the community. This activity is generally referred to as Business Retention and Expansion (BRE).1 This article looks at results from DEED’s Business Employment Dynamics dataset and provides insights and examples from real-life BRE projects from the University of Minnesota Extension’s work with communities in a rural small town and a St. Paul suburb to illustrate BRE’s relative importance. Both the data and stories demonstrate the value of paying attention to existing businesses.
Economic developers do many things to assist existing businesses because of the many valuable benefits these businesses provide to their communities including jobs, goods and services, property and other tax revenues, civic involvement, and more. If all of these activities related to helping local businesses can be classified as BRE work, then BRE visitation is a way for economic development organizations and communities to establish priorities.
For example, the U of M Extension’s Connecting Businesses and Community Program2 uses an intentional process in which communities organize individuals to visit local businesses to demonstrate appreciation and to survey them about their concerns and needs. The data are analyzed in order to respond both to individual business worries as well as to address systemic issues affecting the community’s prospects for keeping and developing the businesses. As noted, this article will use a few examples from the U of M Extension team’s work around Minnesota, but there are other varied models and programs for BRE both in Minnesota and nationally.3 All of these BRE resources can help communities succeed in working with existing business and industry.
Community and economic developers encourage and welcome new jobs from almost any source, whether it be business startups, relocations, or expansions of existing businesses. All these options are vital to a local economy, each contributing to the growth that developers want to see. New businesses often form to address a need that is not currently being met, while existing businesses often adapt to changing marketplace conditions to continue growing.
But after seeing the ribbon cutting at the grand opening or the shovels throwing dirt at the publicly announced business expansion, it’s often hard to quantify where job growth is actually coming from in a community. This prompts the question about which aspect of economic development is more important to focus on: attracting businesses from elsewhere, retention and expansion, or startups. DEED’s Business Employment Dynamics (BED) program can help provide context to better understand these job flows.
From the statistical side, most employment analysis using data from DEED’s Quarterly Census of Employment and Wages (QCEW) program only looks at net change – comparing the total number of jobs in one time period to the total number of jobs in another time period – to gauge progress. For example, there were an average of 2,853,897 jobs reported by employers in Minnesota in 2017, compared to 2,814,002 jobs in 2016, meaning that employers in the state added a net gain of 39,895 new jobs in the past year.
While that is useful for a big picture view of the economy, it doesn’t tell the whole story. Behind that net job change, there was a tremendous amount of churn including job gains and job losses, business expansions and contractions, and openings and closings. These are masked in the net change number from QCEW, but data from the BED program can help provide insights into these job fluctuations through a longitudinal history that links establishment records across quarters.4
Put simply, the BED statistics measure job changes at the establishment level by examining job flows at individual business establishments. Though it does show job flows, it is important to understand that this is not a measure of turnover or movement of workers that are brought about by hires and separations. For example, if during a given quarter a worker leaves an establishment but another worker is hired at the same establishment, the employment levels would be unchanged over the reference period, and BED will show no job gain or job loss at this establishment. Instead, BED is a measure of job gains or losses based on a count of total employment at an establishment in separate time periods. While this article focuses only on job gains from expansions and openings, BED data also show job losses due to contractions and closings. More detailed definitions below help explain how the program works:
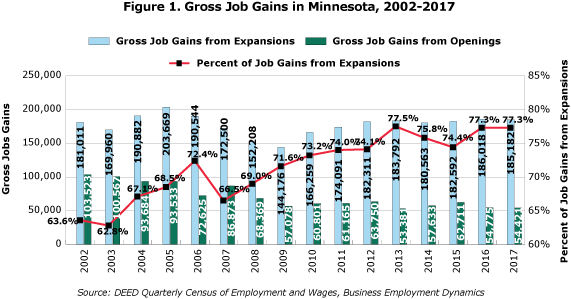
BED statistics are available on a quarterly and annual basis at the state, regional, county, and city levels, and by detailed industry, through DEED’s online QCEW tool. In general, job gains from expansions accounted for about 72 percent of gross job gains on an annual basis, while the other 28 percent came from openings. During the strong recovery experienced this decade, expansions have averaged more than 75 percent of gross job gains, including a high of over 77 percent in three of the past five years (Figure 1).

In sum, BED data shows that the vast majority of job gains in Minnesota come from existing businesses, bolstering the focus on BRE. However, that does not diminish the importance of startups or relocations from out of state. In BED statistics, an establishment opening can only happen one time in a time period – once it has been opened, in the next quarter it would be considered an existing establishment, and therefore would be classified as expanding, contracting, or closing in subsequent quarters.
Interestingly, expanding businesses seem to be the wellspring of job growth during recovery periods and strong economic times, while startups become more important as a source of job gains during recessions. This is demonstrated by the relatively high percentages of job gains from expansions in recent years, compared to a higher reliance on job gains from openings between 2002 to 2004 and 2007 to 2009. Of course, job losses from contractions and closings are also much higher during the recessionary periods, though that is not shown in Figure 1 or included in this article.
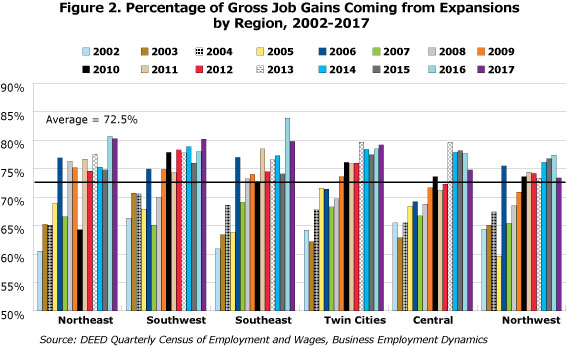
The percentage of jobs gained from expansions is mostly similar across the state, though there are some minor regional differences. Perhaps surprisingly, Southwest Minnesota actually had the highest dependence on job gains from expansions over time, while Northwest added the highest percentage from openings. The Twin Cities and Southeast Minnesota also tended to rely more on job gains from expansions, especially in recent years, whereas Central and Northeast enjoyed slightly more startup activity (Figure 2).

In any case and any location, BED data show that business retention and expansion accounts for the majority of gross job gains in the economy. BED data show that jobs gained from openings also contribute significantly to economic growth, especially during recessionary periods, but never more than 40 percent of gross job gains. And of course, once those new businesses get started, economic developers often work to help them continue to grow in subsequent years.
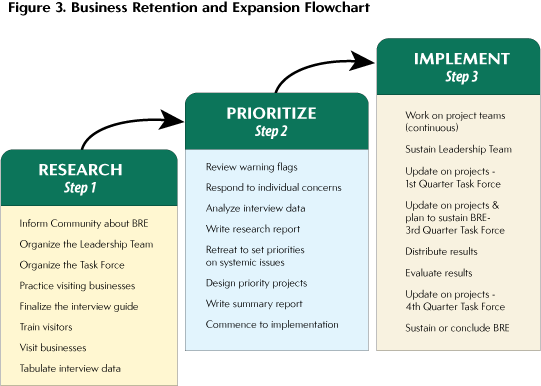
The U of M Extension model involves three big phases: 1. research, 2. prioritize and 3. implement (Figure 3). The result is a set of priority projects and directions to guide BRE efforts in the community. In the research phase a community will build a team and reach out to visit 30 to 60 or more businesses over a couple of months. The team looks for opportunities to assist individual businesses in any way it can in order to keep the business local – paving the way for additional investments in the community. In the prioritize phase surveys are compiled and the data reviewed by a multi-disciplinary group of economic developers, economists, DEED labor market information and business and community development professionals, U of M scholar-practitioners, and community task force members. The community’s task force is then presented a customized report that includes strategies and potential project ideas pertinent to the needs of the visited businesses. This enables the task force to make priority decisions for BRE action. The process culminates in the implement phase, when the community will typically move three to five priority projects into action over the next few years.

Barnesville is a town near Fargo-Moorhead (pop. 2,600) that decided to go all in with its BRE visitation program. Forty-four community members conducted business visits in 2013, covering 69 of its 110 businesses. Over 90 percent of the jobs in the community were represented by the employers that were visited. Since then, many community investments have happened that were directly or indirectly influenced by the survey findings.
Here’s an example of an indirect result of BRE visitation. The BRE survey indicated a strong interest among businesses in having natural gas service. Natural gas was not previously available in the community, but a natural gas provider had been considering providing service to Barnesville. Once they saw the survey findings indicating there would be a strong customer base from among local businesses, the company decided to invest in providing this form of energy in Barnesville.
In another finding, 10 percent of firm owners said they were contemplating retirement, yet almost half (32) of the 69 businesses visited said they had no succession plan in place. In response, four succession planning workshops were held and retiring business owners were connected with entrepreneurs interested in owning a business.5 The four sessions were well attended and, ultimately, they got the job done. Two key businesses transitioned to new ownership -- the Dairy Queen and Barnesville Drug and Hardware (a unique combination that exemplifies small town downtowns). Other businesses are still in the succession planning stages. Business succession is a particularly important priority for a rural community like Barnesville, since baby boomers still own half, or more, of the businesses in rural America and they are retiring at high rates over the next several years. Once a rural business goes away, it is fairly unlikely it will be replaced by a new one. Barnesville helped the U of M Extension see how critical business transition is for rural communities, leading to the development of a new program to help communities with business succession.6
A company that Barnesville volunteers visited in 2013 is now a classic example of small town business retention and expansion. Stoneridge Software started as a business in the owner’s basement. Working with Karen Lauer of the Barnesville Economic Development Authority, Stoneridge moved into a commercial property as it expanded to six jobs. Two relocations and expansions later, Stoneridge has stayed in Barnesville and is now located in a newly restored historic building downtown. It has expanded to over 100 jobs nationally, with the biggest share of those positions (about 40 positions) located in Barnesville.
In the Twin Cities metro area, the suburban city of Cottage Grove (pop. 36,000) visited 41 businesses during their program in 2017. Not surprisingly, workforce emerged as a leading concern for the businesses. In a tight labor market, workforce shortages were looming and have only tightened since then. Cottage Grove’s employer mix includes large manufacturers and health care establishments that need skilled workers. Matt Wolf, economic development official for the city, said "Workforce was one of the most interesting things to come out of the BRE visits. It’s also one of the most frustrating because everyone wants to stay in their own lane. For example, it’s difficult to get businesses to interact with each other on these topics." Nevertheless, Wolf and county economic developer Chris Eng engaged with the South Washington County school district to explore workforce training programs to respond to the reported business needs.
The school district not only heard from the city and county about the need to build local capacity for workforce skills, they also heard directly from employers such as Renewal by Andersen, a window manufacturer. The district’s Park High School in Cottage Grove has a robust career and technical education (CTE) program. However, unlike communities with notable school-to-work programs, there isn’t a technical college in Cottage Grove that businesses could easily partner with. To learn more about how to respond to business workforce concerns, Park High teachers and administrators reached out to other metro school districts such as Mahtomedi and Minnesota State campuses at Century College and St. Paul College.
This school year, Park High School launched its new class called How to Make Almost Anything7 in its new Inventor Space. With startup funding from local businesses and foundations ($142,500), the program is available to all students including learners who don’t plan to go to four-year colleges. As technology teacher Matt Maher explains, “The program will build students’ ability to prototype and make things with a variety of computer and production equipment. This will be a valuable skill for anyone who desires to work for area manufacturers.”
Assistant Principal Gretchen Romain said that the Inventor Space program offers valuable opportunities for Park High School students who tend to remain in their home district at higher rates in comparison to neighboring schools. “Our graduates have living wage manufacturing employment opportunities at all entry points along the continuum of education needed. At Park approximately 50 percent of our graduates go on to a four-year college, 33 percent to a community/technical college, and 17 percent go to work or the military.” The school serves 1,900 students, including 30 percent on free and reduced price lunch. The school also has the highest percentage of English Language Learners (ELL) and homeless in the district.
The emerging program at Park High is a direct response to the identified need for workforce skills among area businesses. Though it is still a pilot program, the local economic developers and district officials have high hopes and big dreams, and the project clearly communicates to businesses that Cottage Grove cares about critical issues facing local businesses.
So what’s next for Barnesville and Cottage Grove for business retention and expansion? Based on the feedback they gathered from local businesses, the economic developers are now pretty sure they know what their priorities should be. Moreover, they’ve established a priority to stay in touch with businesses. Even though they "don’t have the time", these economic developers plan to do more waves of BRE visits to keep connecting with business leaders. There is nothing like visiting business owners to find out exactly what’s on their minds. When communities organize BRE visits in an intentional, systematic manner, they understand the priorities that are beneficial to their local economy, and tap into the strongest source of job gains.
Michael Darger manages UofM Extension’s Connecting Businesses and Community Program. He teaches Business Retention & Expansion (BRE) courses to economic development audiences and provides BRE consulting and applied research for Minnesota communities. A new research interest is retaining businesses as their owners retire by conversion to employee owned cooperatives.
1"Business retention and expansion today" (2017). Community Development, 48:2, pp. 160-161.
2"Retaining businesses in your community." University of Minnesota Extension.
3See Business Retention & Expansion International, International Economic Development Council, and Grow Minnesota! Partnership
4“About QCEW.” Minnesota Department of Employment & Economic Development.
5Barnesville Business Retention and Expansion (BR&E) Strategies Program: Summary Report. pp. 8-13.
6"Supporting rural business succession." University of Minnesota Extension.
7This course title has its roots in MIT’s outreach programming.