
by Alessia Leibert
March 2024
One out of five postsecondary graduates left the region where they earned their degrees to start their careers in other Minnesota regions
Young graduates start settling into careers during the initial years after graduation. Like a deck of cards being slowly reshuffled, graduates tend to gravitate towards places that give them a better opportunity to utilize their degree. Therefore, the geography of jobs for graduates two years after finishing school tells a story about local hiring demand and the unique skills profile of regional labor markets.
Figure 1 maps the detailed flows of graduates from regions of schooling to regions of work. The Twin Cities Metro took the lion's share, 65%, of employed graduates, thanks to its high concentration of businesses and jobs.
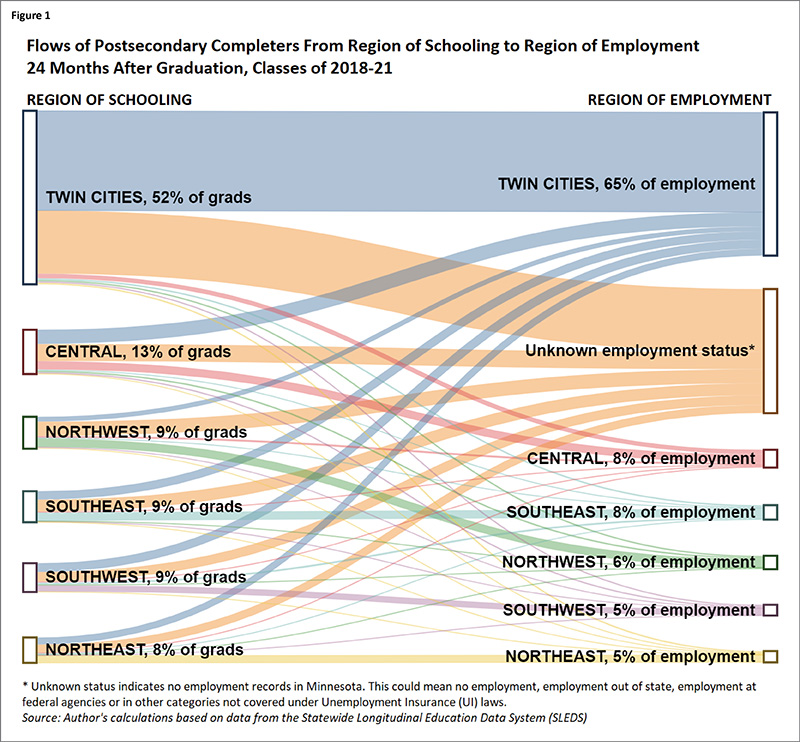
The rank-ordering of regions by number of graduates (left-side of the chart) differs slightly from the rank-ordering of regions by number of employed graduates (right-side of the chart), indicating that some regions experienced a positive balance while others experienced a negative balance. For example, the Twin Cities Metro employed more graduates than it produced, 65% versus 52%. Other regions experienced negative balances, especially Central, Southwest, Northwest and Northeast. The thickness of the flows gives a clue of what could drive these results. A thick flow of graduates, colored in blue, left Central Minnesota to work in the Twin Cities. Southwest, Northwest and Northeast Minnesota, in contrast, lost a large chunk of graduates to the "unknown employment status" category, colored in orange. This category encompasses a variety of circumstances such as self-employment, unemployment, employment in small farms or employment out of state. In the case of border regions, the orange outflow likely represents graduates who found jobs in neighboring states, though a few working on small farms might also have been missed1.
These flows are the result of two different forces: retention of local graduates and attraction of graduates from outside the region. Retention rates of locally trained graduates are illustrated in Table 1.
| Table 1 - Retention of Local Graduates by Region 24 Months After Graduation | ||||
|---|---|---|---|---|
| Region of Postsecondary Schooling | Number of Graduates 2018-2021* | Employed in Same Region (Retention) | Employed in Different Region | Unknown Employment Status |
| Twin Cities Metro | 124,236 | 57% | 7% | 36% |
| Central | 31,200 | 19% | 43% | 38% |
| Northwest | 22,452 | 27% | 29% | 44% |
| Southeast | 21,844 | 27% | 34% | 39% |
| Southwest | 20,289 | 22% | 44% | 33% |
| Northeast | 17,909 | 29% | 39% | 32% |
| Greater MN as a whole | 113,694 | 24% | 38% | 38% |
| TOTAL, statewide | 237,930 | 41% | 22% | 37% |
| *Graduates who completed more than one postsecondary credential were classified according to the highest award completed to avoid counting the same individual multiple times.
Source: Author's calculations from SLEDS (Statewide Longitudinal Education Data System). |
||||
After earning their credential, a total of 22% (one out of five) of Minnesota graduates were employed outside the region of schooling. But Greater Minnesota as a whole fared much worse than the Twin Cities Metro, losing 38% of its postsecondary graduates to other regions and another 38% to the "unknown employment status" category. Regions with long interstate borders, such as Northwest and Southeast, experienced the largest loss of graduates to this unknown category, with rates of 44% and 39% respectively. Both regions attract students who were residents of North Dakota, Iowa or Wisconsin and who might have returned to their home states for work after graduation.
All regions, except the Twin Cities Metro, appear to suffer from low retention; however, that can be offset by attracting graduates from other regions with the prospect of good jobs. For example, the Southeast region retained only 27% of its graduates, yet it managed to attract some from other regions to achieve a fairly neutral balance of college-educated workers employed (8%, shown in Figure 1). Central Minnesota, by contrast, suffered the large net loss displayed in Figure 1 both because of low retention of local graduates (only 19%) and because it did not hire enough graduates from outside the region to compensate for the loss.
Incentives to leave the region of schooling can be very personal, including lifestyle preferences, proximity to family and commuting distances. Still, as this analysis shows, one of the most powerful incentives is the pull of economic opportunity. Graduates are more likely to move to places where hiring in their career field is stronger and jobs are better paid.
Information on regions of employment of recent graduates by degree, major and school is publicly accessible through the Graduate Employment Outcomes (GEO) tool. All charts in the remainder of this article are from the GEO tool and represent only employed graduates.
We begin by looking at the overall distribution of employed graduates by region (Figure 2), replicating some of the information displayed in Figure 1 with the addition of median wages earned in each region. Wage information adds an important dimension to this analysis because it reveals a potential financial incentive to move. Wages were highest in Southeast Minnesota and the Twin Cities Metro and lowest in Southwest Minnesota.
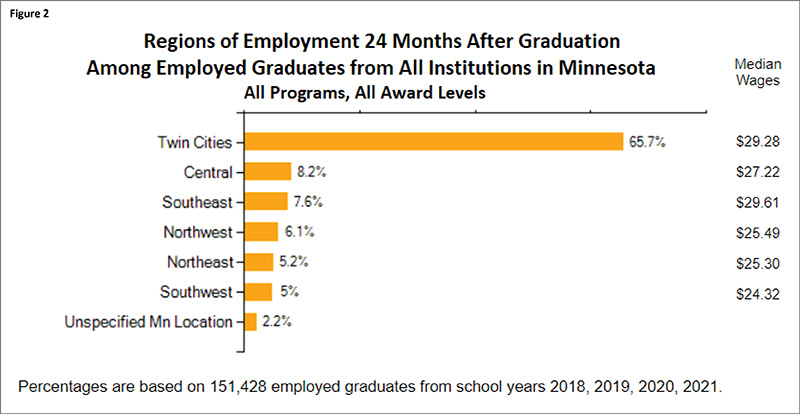
When we further drill down into these data, we discover that the higher the education level, the higher the propensity to leave Greater Minnesota to work in the Metro. Completers of advanced degrees who earned their credential from institutions in Greater Minnesota2 were twice as likely to relocate to the Twin Cities Metro than completers of certificates below Bachelor's. That's mostly because the Metro is home to high tech companies and firm headquarters that need workers with four-year degrees (and above). This evidence demonstrates the key role of technical/vocational schools in supplying talent to Greater Minnesota employers, contributing to local economic growth.
Besides degree level, field of study is another key factor determining where on the map graduates are most likely to cluster in the first two years following graduation. Each region attracts talent in economic sectors that are unique to its economy. Looking at where graduates from certain fields chose to start their career reveals each region's unique competitive advantage in retaining and attracting a college-educated workforce.
Twin Cities Metro: The region is very successful in building jobs that require a four-year degree or higher credential in STEM (Science, Technology, Engineering and Math). Figure 3 shows that of the 1,825 Bachelor's of Computer Science graduates who remained in Minnesota for work, 82.1% were working in the Twin Cities Metro 24 months after graduation. This chart doesn't tell us who moved out of their region of schooling, because it captures both graduates who attended college in the Metro (1,161 in total) and those who attended college in Greater Minnesota (664 in total). However, we can tell that graduates were heavily concentrated in the Twin Cities Metro3, followed by Southeast Minnesota with 6.6% of graduates. Job opportunities in other parts of the state were nearly non-existent or not compensated enough to attract more graduates.
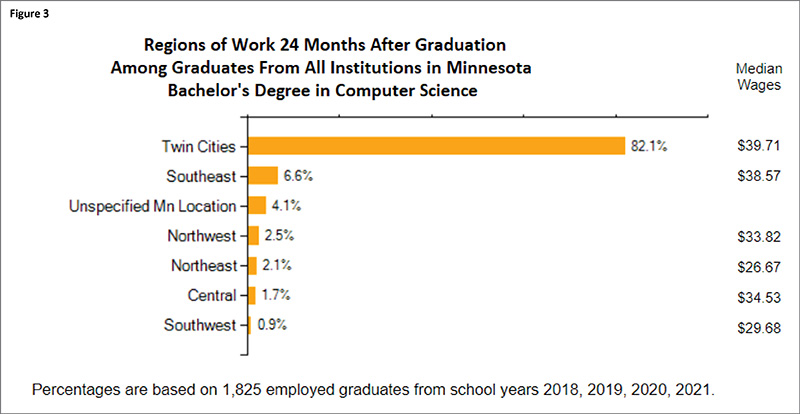
Why do these graduates cluster in the Metro? The GEO tool also shows employment by industry, which helps answer the question. We discover that the top industries of employment for Computer Science graduates are related to STEM: Professional & Technical Services, Information and Finance & Insurance. This makes it natural for graduates to gravitate to the Metro, which has the highest concentration of employment in these industries.
Southeast: The power of attraction of this region is tied to high demand for a skilled health care workforce and the presence of some high paying employers. Southeast Minnesota absorbed 13.6% of recent Bachelor's of Nursing graduates who remained in Minnesota after graduation (Figure 4). This share may not seem very high, but it is actually twice as big as the region's total share of Minnesota employed graduates shown in Figure 2. In other words, hiring demand for bachelor-educated nurses in this region is twice as high as the region's overall demand for recent graduates.
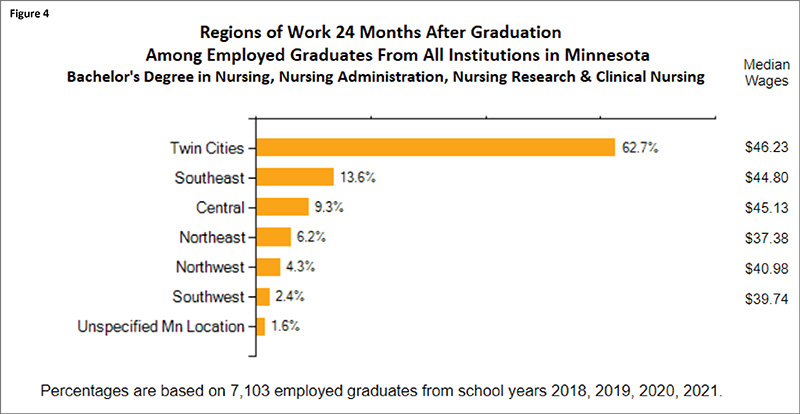
Median wages in Southeast for individuals with these credentials were very competitive, at $44.80. We notice large differences in hourly wages across regions among individuals with the same type of major. What might cause these differences? Small rural hospitals and nursing homes in outstate Minnesota may not need as many bachelor's educated nurses to begin with, and when they need them they may not be able to pay the same salaries as their competitors in the Metro.
Central: This region is characterized by a thriving manufacturing sector that generates demand for people with skills in Precision Metal Working, absorbing 14.9% of total statewide supply (Figure 5). These programs typically prepare for careers as Welders, Machinists, CNC Operators and other occupations related to metal or plastic production.
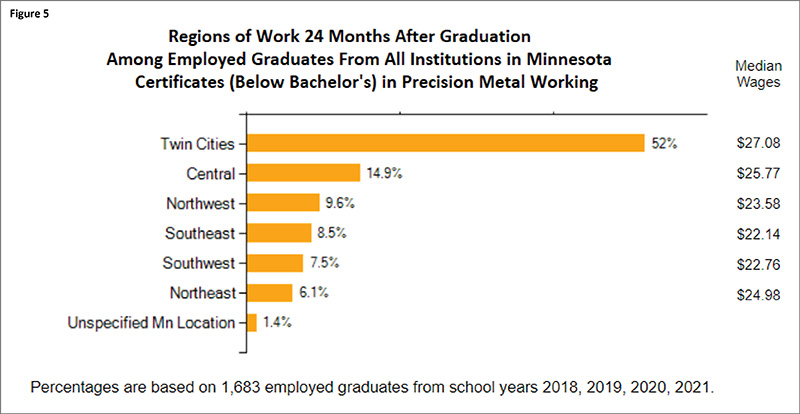
Graduates in Central Minnesota earned median wages of $25.77, significantly higher than the family-sustaining wage of $19.464 and comparable with those earned by graduates in the Twin Cities Metro. These competitive wages indicate high demand in the region for workers with these credentials.
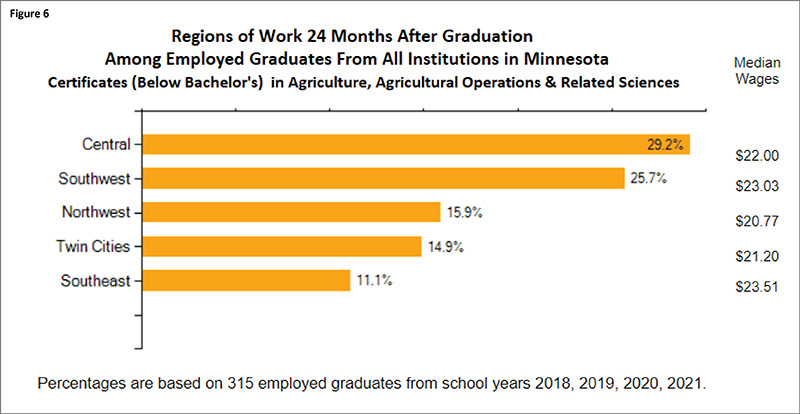
Southwest: The region's economy is heavily agriculture-driven. Therefore, it comes as no surprise that it absorbed 25.7% of the supply of employed graduates in agricultural-related majors, second only to Central Minnesota (Figure 6). The Twin Cities Metro absorbed only 14.9% of individuals with these credentials and paid lower wages ($21.20 versus $23.03 in Southwest). The Metro offers fewer job opportunities in these fields and enrolls fewer students in these training programs compared to other regions.
Northwest: This region hired the fourth largest share (15.5%) of individuals majoring in Ground Transportation (Figure 7). This share may not seem high, but it is actually more than twice as big as the region's share of employed graduates shown in Figure 2 (15.5% versus 6.1%), indicating a disproportionally high hiring demand in this region for workers with these credentials.
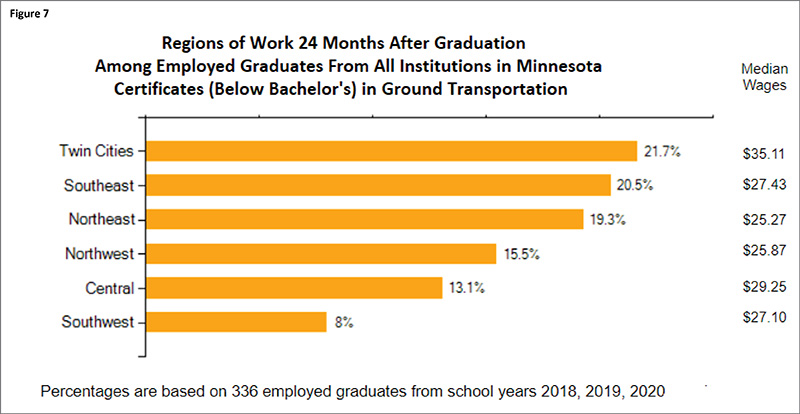
Ground Transportation programs include truck driving and heavy equipment operations for road construction, leading to employment in the Transportation & Warehousing industry. Trucking and road construction skills are highly needed in Greater Minnesota to move agricultural and other products to the local processing plants and from the plants to wholesalers across the country.
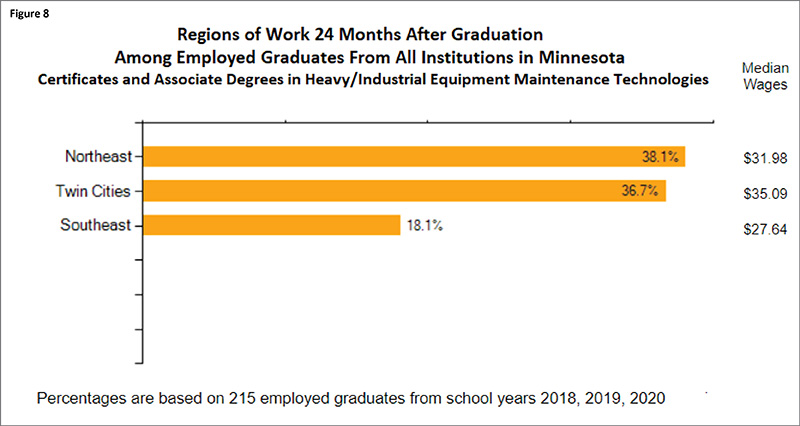
Northeast: The Arrowhead is the most popular region of destination for individuals majoring in Heavy/Industrial Equipment Maintenance Technologies (Figure 8). That's because 20% of these graduates get hired by the mining industry, which is unique to Northeast Minnesota.
The GEO tool allows users to drill down to 98 schools to explore the geographies and industries of destination of their recent graduates. This information can be valuable to current and prospective students interested in knowing where their peers found jobs, and at what wages.
The evidence presented in this article clearly demonstrates that graduates are responsive to regional differences in economic opportunity for jobs requiring their credentials and take them into consideration when choosing where to start a career. It also underscores the importance of building a local education pipeline well aligned with local industry needs to promote the retention of young talent.
1Some graduates in these regions might have been employed in Agriculture, especially small farms, which are not required to report their employees under Unemployment Insurance laws and therefore may have been missed by our data.
2The Graduate Employment Outcomes tool allows users to filter all data by school location, distinguishing between schools located in the Metro and schools located in Greater Minnesota.
3The GEO tool also tells us that 664 graduates attended college in Greater Minnesota. Of those, 64.5% were working in the Metro
4According to the cost of living tool, $19.46 is the minimum wage needed to sustaining a typical family in Minnesota. This benchmark is based on the fact that the most typical family structure in Minnesota is one fulltime worker, one part-time worker, and one child.