by Cameron Macht
April 2016
Although the state is already facing a shortage of dentists, demand for dentists is likely to continue growing in the future as the population ages, access to health insurance increases, and cosmetic dental services become more attractive. With each generation learning more about how important oral health is to overall health, dentists have become a vital part of the healthcare community.
Despite the expansion in demand, the number of dentists has remained relatively flat over time. According to data from the Minnesota Board of Dentistry, just under 4,000 dentists received or renewed licenses in both 2011 and 2016. Through April 1, 2016 there were 3,983 dentists in the state, including 3,690 that had an active practice and 293 that had an active license but were not practicing.1
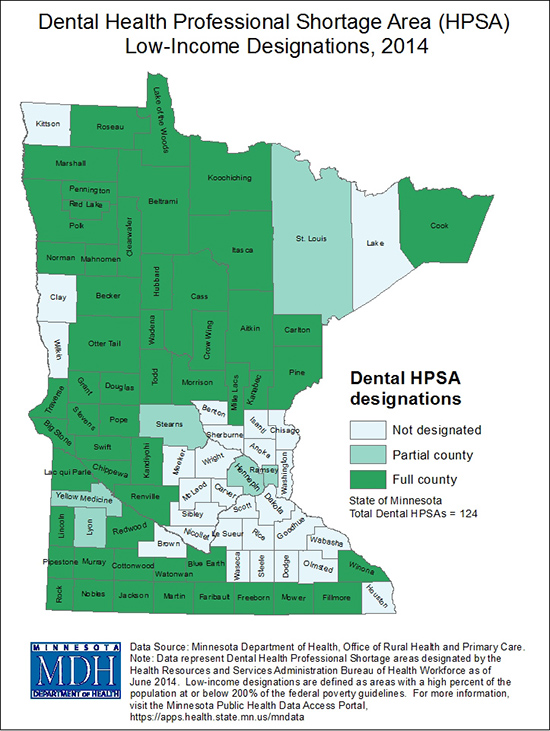
Consequently, 53 of 87 counties in the state were considered a full county dental health professional shortage area (HPSA), and six more were partial. HPSAs are "areas with lower access to dental/oral health care and populations with greater risk of dental diseases and oral conditions." Although the shortages were more common and acute in rural areas, the metropolitan counties of Hennepin, Ramsey, Stearns, St. Louis, and Blue Earth County were either partial or full HPSAs (see Map 1).2

In order to accommodate more patients and expand their practices, dentists are relying on more hygienists and dental assistants and implementing new technology to improve productivity. The number of licensed dental hygienists increased 8.4 percent from 2011 to 2016 to 5,615, while dental assistants grew 2.9 percent to 7,304. There are now over three times as many licensed hygienists and assistants as there are dentists in the state.
While dental assistants and hygienists can be trained quickly at 2-year technical colleges, increasing the number of dentists takes much longer. In addition to a bachelor's degree, dentists must earn a Doctor of Dental Surgery (DDS) or a Doctor of Medicine in Dentistry (DMD) degree and pass a state licensure exam. Dentists must take courses in anatomy, biology, chemistry, local anesthesia, periodontics (the study of oral health), and radiology followed by clinical experience under the supervision of a licensed dentist.
Data from DEED's Graduate Employment Outcomes program show the disparity in the pipeline. In the most recent school year, nearly 625 students earned certificates, associate's, or bachelor's degrees in dental support services, compared to 107 students who completed graduate degrees in dentistry and 32 new doctors in advanced dentistry and oral sciences, which includes endodontics, oral and maxillofacial surgery, and orthodontics (see Table 1). Almost two-thirds of the employed graduates from dentistry programs over the past four years found jobs in the Twin Cities with the rest scattered across Greater Minnesota. Strangely, wages for these graduates were higher in every region outside the Twin Cities.
| Minnesota Graduate Employment Outcomes, 2012-2013 | ||||
|---|---|---|---|---|
| Award Level | CIP Code | Instructional Program | 2 Years After Graduation | |
| Number of Graduates | Median Hourly Wage | |||
| Graduate Degree | 51 | Dentistry | 107 | $66.11 |
| Graduate Degree | 51.1 | Advanced/Graduate Dentistry & Oral Sciences | 32 | $47.18 |
| Bachelor Degree | 51.1 | Dental Support Services & Allied Professions | 109 | $31.19 |
| Associate Degree | 51.1 | Dental Support Services & Allied Professions | 345 | $20.76 |
| Certificates | 51.1 | Dental Support Services & Allied Professions | 167 | $17.29 |
| Source: DEED Graduate Employment Outcomes | ||||
While the schooling is long and therefore expensive, the investment in education definitely pays off. With an average annual wage around $200,000, dentists rank near the top of highest paying jobs in the state of Minnesota. As with recent graduates, wages were higher for all dentists in Greater Minnesota than the Twin Cities with the highest wages reported in Southwest Minnesota (see Table 2).
| Minnesota Employment and Wages for Dentists, 2015 | |||
|---|---|---|---|
| Geography | Estimated Employment | Average Hourly Wage | Average Annual Wage |
| Minnesota | 1,700 | $94.42 | $196,394 |
| Twin Cities Metro | 1,030 | $92.05 | $191,464 |
| Southeast | 220 | $90.33 | $187,886 |
| Northeast | 120 | $90.75 | $188,760 |
| Southwest | 110 | $118.00 | $245,440 |
| Northwest | 90 | $97.90 | $203,632 |
| Central | 80 | $92.93 | $193,294 |
| Source: DEED Occupational Employment Statistics | |||
Like the graduate outcomes data, the salary survey data only cover dentists who work in employer establishments. However, many dentists own a private practice and work alone or with a small staff.
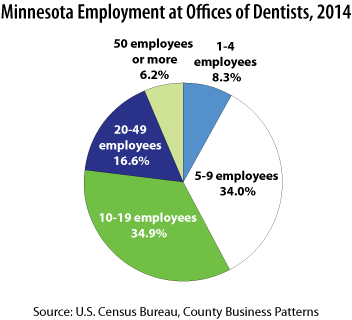
Employer size data from the U.S. Census Bureau's County Business Patterns program show that more than three-fourths of total employment at offices of dentists are found in firms with fewer than 20 employees (see Figure 1).

As employers, dentists must have leadership and management skills and must be able to communicate effectively with their staff and patients. Speaking of patience, dentists must be detail-oriented and have the physical stamina and dexterity to bend over and work in small spaces for long periods of time.
Long-term, demand for dentists is expected to increase almost three times as fast as the total of all occupations, leading to 650 total openings in the state. Similarly, orthodontists, hygienists, and assistants are all projected to grow between 10 and 12 percent from 2014 to 2024 (see Table 3).
| Minnesota Employment Outlook, 2014-2024 | ||||||
|---|---|---|---|---|---|---|
| Occupation | Estimated Employment 2014 | Projected Employment 2024 | Percent Change 2014-2024 | Numeric Change 2014-2024 | Replacement Openings 2014-2024 | Total Openings 2014-2024 |
| Total, All Occupations | 3,007,000 | 3,137,000 | 4.3% | 130,000 | 696,940 | 860,360 |
| Dentists, General | 2,060 | 2,287 | 11.0% | 227 | 420 | 650 |
| Oral and Maxillofacial Surgeons | 34 | 36 | 5.8% | 2 | 10 | 10 |
| Orthodontists | 67 | 74 | 10.4% | 7 | 10 | 20 |
| Dentists, All Other Specialists | 92 | 96 | 4.3% | 4 | 20 | 20 |
| Dental Hygienists | 4,598 | 5,149 | 11.9% | 551 | 760 | 1,310 |
| Dental Assistants | 5,492 | 6,135 | 11.7% | 643 | 1,360 | 2,000 |
| Source: DEED Employment Outlook | ||||||
1Minnesota Board of Dentistry Active Licensee Totals
2Dental Workforce: Dental Health Professional Shortage Areas.