by Derek Teed
April 2017
Note: Until 4th quarter 2016 data are available, annual average data are 15/4 through 16/3.

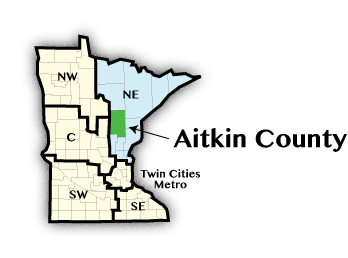
Aitkin County was established in 1857 from Ramsey County and named after the fur trader William Aitkin.1 In 1871 the Northern Pacific Railroad line to Aitkin County had greatly expanded Aitkin’s timber industry and commerce. Over time the tourism and agriculture industry expanded as well.
Aitkin County will continue to be a destination for tourism as people are attracted to the fishing, biking, trails, wildlife, hunting, snowmobiling, golfing, lakes, rivers, and area parks.
Some high-grade copper has been found and exploration is ongoing. If copper prices rise, there is a possibility of mining project(s) coming to the Aitkin County in the distant future.2
| Industries3 | |||||
|---|---|---|---|---|---|
| Aitkin | Top Industries of Employment | Total Employees in 2015 vs 2006 | Annual Wages2015 vs 2006 | ||
| - | Total, All Industries | 3,771 | -12.4% | $33,020 | 28% |
| 1 | Education and Health Service | 1,109 | 1.2% | $40,196 | 28% |
| 2 | Trade, Transportation, and Utilities | 875 | -15% | $29,328 | 22% |
| 3 | Leisure and Hospitality | 514 | -2.9% | $11,908 | 24% |
| 4 | Manufacturing | 326 | -20% | $42,848 | 49% |
| Note: Increase and decline percentages are comparisons between year 2015 and 2006 | |||||
| Economy4 | ||
|---|---|---|
| - | Aitkin County 2016 | Minnesota 2016 |
| Population | 15,702 | 5,489,594 |
| Labor Force | 7,049 | 2,990,254 |
| Average Unemployment | 6.3% | 3.9% |
| Average Annual Income | $33,943 | $54,457 |
| Cost of Living, Single person | $27,947 | $30,084 |
| Cost of Living, Two working parents + Two children | $70,424 | $80,976 |
TrendsThere is a national trend for manufacturing jobs to decrease while skills and wages for those jobs have increased as the sector is seeing a rise in productivity and automatization. This might explain the decrease in jobs but increase in wages for Aitkin's manufacturing sector.5 Health Services and the Education sector tend to have the highest employment in rural areas. In Aitkin County the government sector employs approximately 375 Elementary and Secondary school employees year-round. As a tourist destination, Aitkin County has establish numerous resorts, restaurants, and hotels. However, the employment in Leisure and Hospitality is often part-time, thus the wages are lower on average. This brought down the average annual income of $33,943 for Aitkin County versus the Minnesota average of $54,457. |
1"History of Aitkin County." History of Aitkin County. Accessed March 15, 2017.
2Myers, John. "More exploratory drilling in Aitkin County." Duluth News Tribune. December 06, 2016. Accessed March 15, 2017.
3Quarterly Census of Employment and Wages
5Kirby, Thomas H., Davenport, Julia. "Beyond Automation." Harvard Business Review. November 03, 2016. Accessed March 15, 2017..

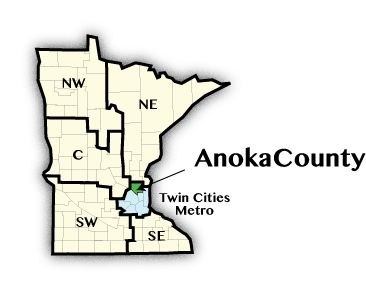
Anoka County was established in 1857. The first large industry to develop was the Timber industry. In the 1850s and 1860s timber was cut in Anoka County, which helped develop sawmills, woodworking plants, and barrel shops. After the main timberland was cut down, the timber would be cut north of Anoka and sent down the Mississippi River to be processed in Anoka.1
The largest employers at the 6-digit industry level are Elementary and Secondary Schools, General Medical and Surgical Hospitals, Electromedical and Electrotherapeutic Apparatus Manufacturing, and Machine Shops Manufacturing. These industries will likely stay the top employers for the medium-term to meet the medical needs of the aging population.
| Industries2 | ||||||
|---|---|---|---|---|---|---|
| Anoka | Top Industries of Employment | Total Employees in 2015 vs 2006 | Annual Wages 2015 vs 2006 | |||
| - | Total, All Industries | 118,622 | 2.4% | $50,024 | 23% | |
| 1 | Education and Health Service | 25,795 | 15% | $50,076 | 24% | |
| 2 | Trade, Transportation, and Utilities | 25,674 | 2% | $41,548 | 17% | |
| 3 | Manufacturing | 22,655 | -4% | $79,560 | 29% | |
| 4 | Leisure and Hospitality | 12,640 | 12% | $16,796 | 31% | |
| Note: Increase and decline percentages are comparisons between year 2015 and 2006 | ||||||
| Economy3 | ||
|---|---|---|
| - | Anoka County 2016 | Minnesota 2016 |
| Population | 344,151 | 5,489,594 |
| Labor Force | 189,652 | 2,990,254 |
| Average Unemployment | 3.7% | 3.9% |
| Average Annual Income | $51,012 | $54,457 |
| Cost of Living, Single person | $32,929 | $30,084 |
| Cost of Living, Two working parents + Two children | $90,974 | $80,976 |
TrendsThe estimated immigrant population of Anoka Country grew from 3.6% in 2003 to 7.2% of the population in 2012. The highest immigrant population is in Hilltop, Columbia Heights, and Fridley.4 As the population ages, the immigrants are likely to integrate into the workforce to replace the aging residents. In 2030 the largest age groups are projected to be 60-64 and 65-69 years of age. This demographics shift will also bode well for the healthcare jobs in Anoka. In 2015 the highest wages in Anoka County were in the manufacturing industry sector. The average wages were $79,560 in Anoka versus $63,336 for the state of Minnesota and $64,324 for the U.S. |
1Pratt, Anna. "Anoka's logging industry: Bygone but not forgotten." Star Tribune. January 6, 2015. Accessed March 21, 2017.
2Quarterly Census of Employment and Wages
4"Anoka County Community Health Data Book." Anoka County. September 2014.

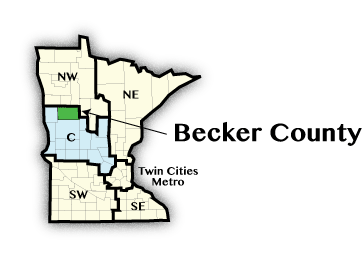
Becker County was established in 1858. The first industry to arrive was a flour mill in 1871 along with a North Pacific Railroad line. The first major industry was the Fargo-Detroit Ice Company that bottled and sold pure spring water.1
Becker County will likely continue to grow manufacturing jobs in the future.2 In 2000 manufacturing jobs totaled 1,752 with the average wage of $29,952. In 2015 the total number of manufacturing jobs was 2,097 with wages of $45,864. Most of the manufacturing jobs are in Fabricated Metal Product Manufacturing, which currently employs over 1000 people and provides much higher wages than the average wages of $48,880 in Becker.
With a higher proportion of the population between ages 45-69, the health services jobs will likely stay in high demand. In 2015 Health Care and Social Assistance jobs accounted for 2,100 jobs, and Nursing and Residential Care Facilities account for almost 600 jobs.
| Industries3 | |||||
|---|---|---|---|---|---|
| Becker | Top Industries of Employment | Total Employees in 2015 vs 2006 | Annual Wages 2015 vs 2006 | ||
| - | Total, All Industries | 14,148 | 9% | $36,036 | 30% |
| 1 | Education and Health Service | 3,205 | 3% | $37,076 | 19% |
| 2 | Trade, Transportation, and Utilities | 2,990 | 9% | $33,384 | 34% |
| 3 | Manufacturing | 2,097 | 0.1% | $45,864 | 31% |
| 4 | Leisure and Hospitality | 1,617 | 16% | $13,676 | 40% |
| Note: Increase and decline percentages are comparisons between year 2015 and 2006 | |||||
| Economy4 | ||
|---|---|---|
| - | Becker County 2016 | Minnesota 2016 |
| Population | 33,386 | 5,489,594 |
| Labor Force | 18,281 | 2,990,254 |
| Average Unemployment | 4.6% | 3.9% |
| Average Annual Income | $36,959 | $54,457 |
| Cost of Living, Single person | $26,744 | $30,084 |
| Cost of Living, Two working parents + Two children | $63,839 | $80,976 |
TrendsA national trend shows manufacturing jobs decreasing while skills and wages for those jobs have increased as the sector is seeing a rise in productivity and automatization.3 However, Becker County seems to be growing both in wages and in manufacturing jobs. The County has been active with their Comprehensive Plan in 2003 to promote the development of Rural and Shoreland Development, Economic Development, Natural Resources, Transportation, and Infrastructure.4 As a tourist destination, Becker County has used its wildlife attractions to help establish and grow the Leisure and Hospitality industry. The county's shoreland and economic development should help this industry continue to prosper.5 |
1"Becker County History." Becker County History. Accessed March 21, 2017.
2Comprehensive Plan for Becker County. Becker County. 2003. Accessed March 22, 2017.
3Quarterly Census of Employment and Wages
5Kirby, Thomas H., Davenport, Julia. "Beyond Automation." Harvard Business Review. November 03, 2016. Accessed March 15, 2017.
6IBID

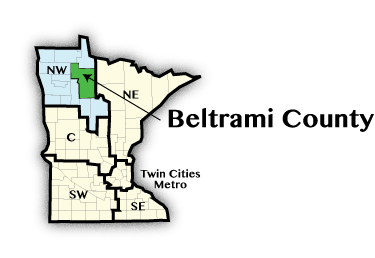
Beltrami County was created in 1866. Starting in the late 1890s the timber industry helped grow the population after railroad lines were built to Bemidji.1 Many sawmills operated until the 1920s when the prime timberlands had been harvested.
Healthcare and Social Assistance is likely to continue to grow in employment as the population in Beltrami ages and lives longer. This industry increased from 2,643 jobs in 2000 to 3,790 jobs in 2015.
Colleges, Universities, and Professional Schools employed 490 people in 2000 and 532 people in 2015. Education is an important industry in Beltrami County with these post-secondary institutions: Bemidji State University, Northwest Technical College, Red Lake Nation College, and Oak Hills Christian College. Employment in the universities may not grow, but it will remain an important part of the economy with higher average wages of $57,460 in 2015.
| Industries2 | |||||
|---|---|---|---|---|---|
| Beltrami | Top Industries of Employment | Total Employees in 2015 vs 2006 | Annual Wages 2015 vs 2006 | ||
| - | Total, All Industries | 19,004 | 6% | $38,220 | 31% |
| 1 | Education and Health Service | 6,022 | 14% | $48,568 | 33% |
| 2 | Trade, Transportation, and Utilities | 4,043 | 0.6% | $31,980 | 36% |
| 3 | Leisure and Hospitality | 2,427 | 17% | $14,300 | 27% |
| 4 | Public Administration | 1,813 | 14% | $43,368 | 20% |
| Note: Increase and decline percentages are comparisons between year 2015 and 2006 | |||||
| Economy3 | ||
|---|---|---|
| - | Beltrami County 2016 | Minnesota 2016 |
| Population | 45,672 | 5,489,594 |
| Labor Force | 23,636 | 2,990,254 |
| Average Unemployment | 5.1% | 3.9% |
| Average Annual Income | $39,338 | $54,457 |
| Cost of Living, Single person | $26,733 | $30,084 |
| Cost of Living, Two working parents + Two children | $63,618 | $80,976 |
TrendsThe following major industry sectors have decreased in employment from 2000 to 2015:
It has yet to be seen if these industries will recover. As a tourist destination, Beltrami County will likely continue growing their Food Services and Traveler Accommodation sectors owing to the county's numerous lakes and wildlife attractions. However, the wages in these sectors are lower than average because of seasonality. |
1Young, Larry. "Bemidji Minnesota Area History." Bemidji Minnesota Area History. Accessed March 23, 2017.