

by Luke Greiner, Cameron Macht, and Mark Schultz
June 2022
As Southwest Minnesota's economy continues to recover from the pandemic recession, the region's labor force constraints continue to hold back more robust growth. Following the most recent Job Vacancy Survey, data show there were just three available unemployed jobseekers for every 10 job openings in the region, tying it for the lowest ratio of the six planning regions in the state. By that measure, this is the tightest the labor market has ever been in the region and the state as a whole.
Evidence of the current workforce shortage has been emerging in Southwest across the last three decades. The number of new workers joining the labor force each year has been declining for some time, from a steady gain of more than 2,200 additional workers per year in the 1990s to around 500 new workers per year in the 2000s. However, in the 2010s, the region was starting to see labor force declines, and ended 2020 with 5,000 fewer workers than it had at the beginning of the decade.
To further complicate the labor market landscape in Southwest, the region is expected to lose over 10,500 labor force participants in the next 10 years as well, based on projections from the Minnesota State Demographic Center. If those projections hold true, employers in the region will have to get used to tight labor market conditions and find new ways to find new workers. As noted, job vacancies are higher than ever and the region is also projected to see a large number of new jobs created and replacement openings through 2030.
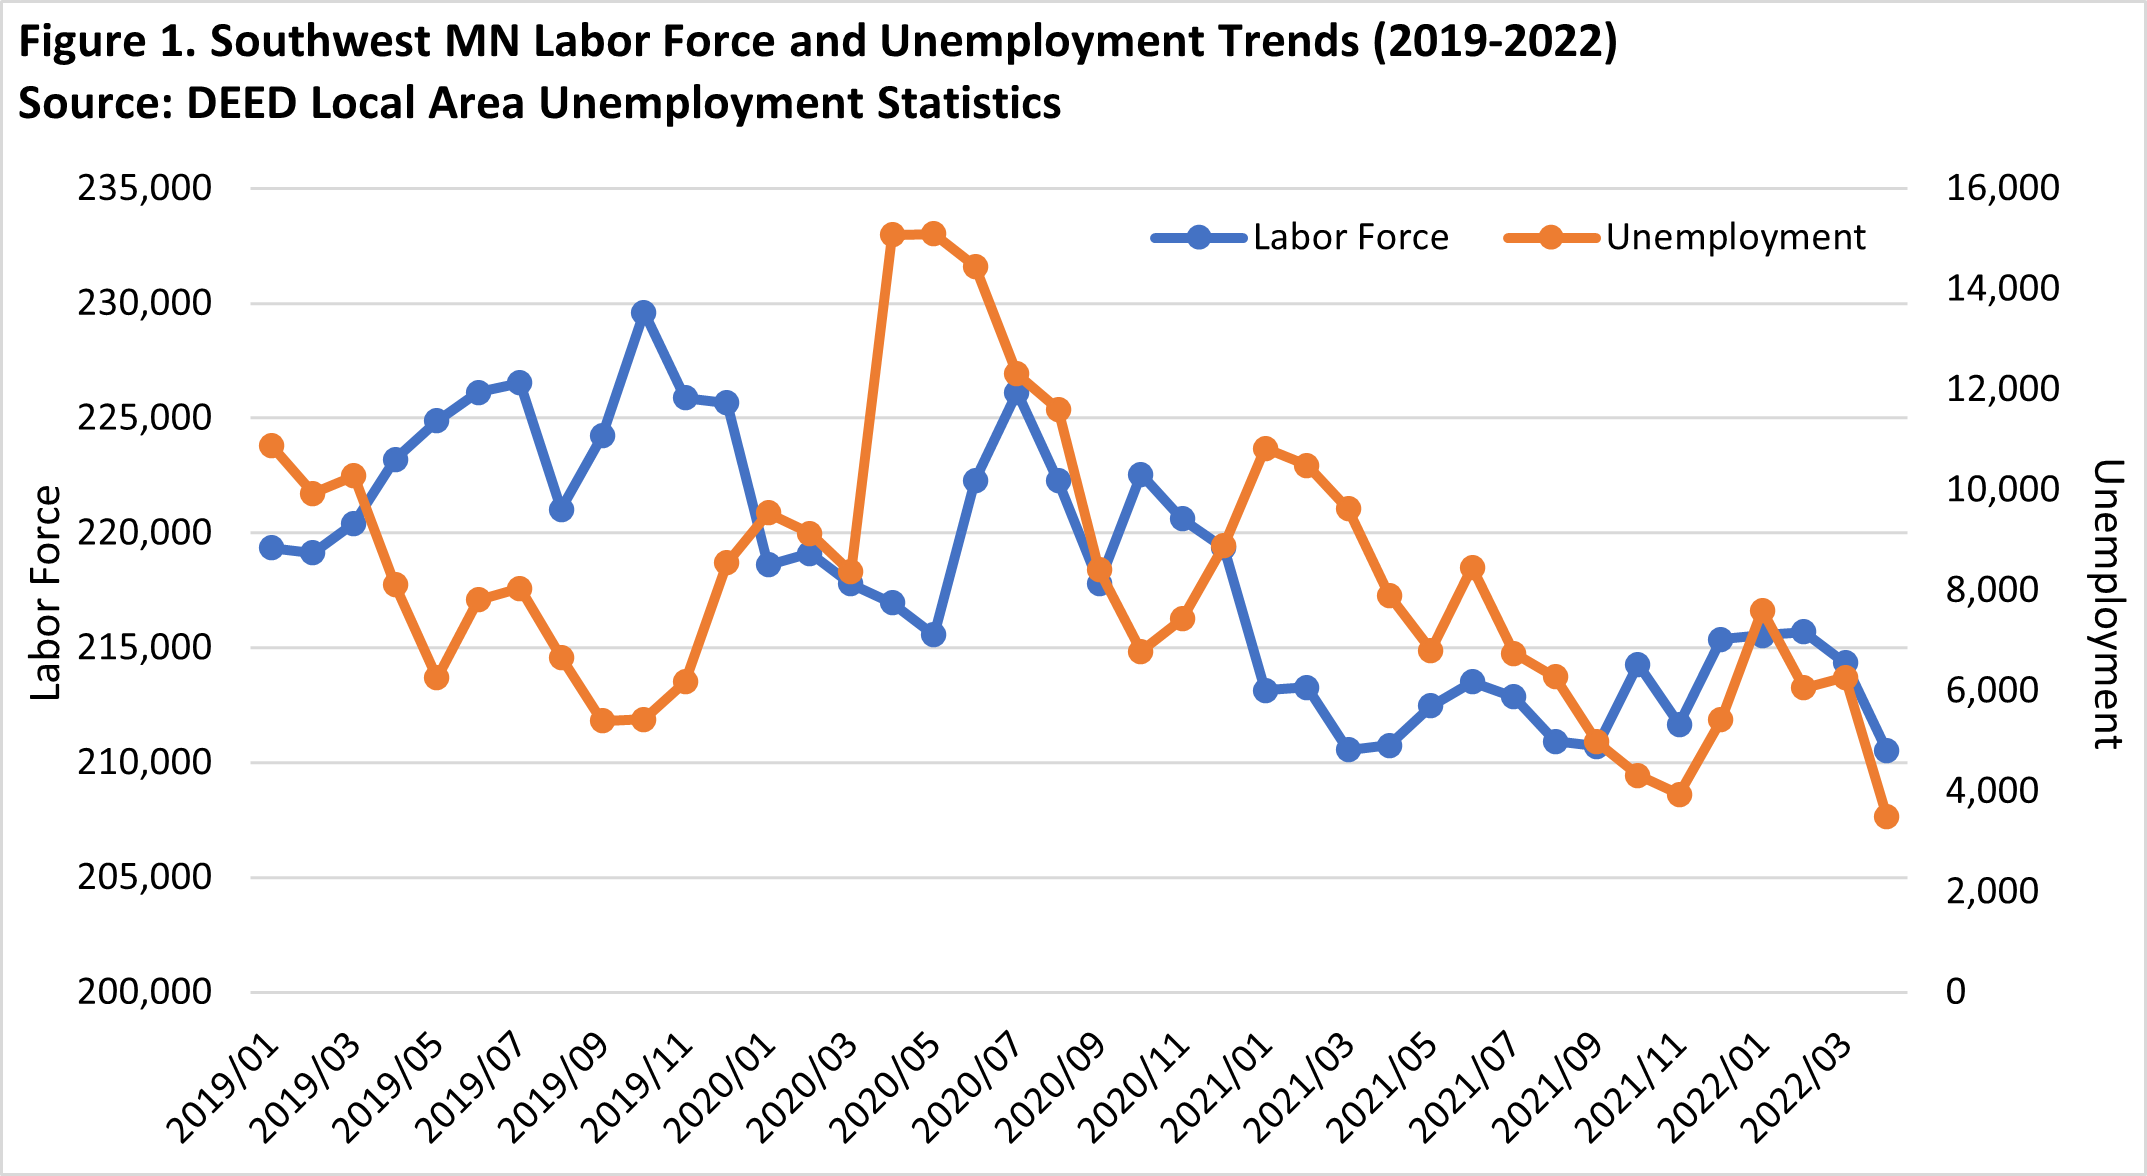
There is no question that COVID-19 had a tremendous impact on the labor force and unemployment numbers in Southwest. While the region did see spikes in both labor force and unemployment numbers during the outset of the pandemic, both measures were down from January of 2019 to the most recent estimate for April of 2022. The labor force dropped by over 8,800 participants during that timeframe, a decrease of 4%, which was the highest proportional loss of all six planning regions and the state. Likewise, the number of unemployed individuals experienced a large loss of just over 7,400 people for a decline of 68%, which is also the highest proportional loss of all the planning regions and state as a whole (see Table 1 and Figure 1).
| Table 1. Regional Labor Force and Unemployment Changes, January 2019-April 2022 | |||||||
|---|---|---|---|---|---|---|---|
| Labor Force | |||||||
| - | Central | Northeast | Northwest | Southeast | Southwest | Metro | Minnesota |
| Jan-19 | 396,525 | 164,020 | 301,005 | 283,885 | 219,344 | 1,712,718 | 3,098,004 |
| Apr-22 | 391,828 | 158,034 | 292,612 | 280,676 | 210,508 | 1,737,545 | 3,071,203 |
| Numeric Change | -4,697 | -5,986 | -8,393 | -3,209 | -8,836 | -24,827 | -26,801 |
| Percent Change | -1.2% | -3.6% | -2.8% | -1.1% | -4.0% | -1.4% | -0.9% |
| Unemployment | |||||||
| - | Central | Northeast | Northwest | Southeast | Southwest | Metro | Minnesota |
| Jan-19 | 22,300 | 10,015 | 20,243 | 11,136 | 10,889 | 57,306 | 136,061 |
| Apr-22 | 7,524 | 3,730 | 6,552 | 4,047 | 3,488 | 24,651 | 49,988 |
| Numeric Change | -14,776 | -6,285 | -13,691 | -7,089 | -7,401 | -32,655 | -86,073 |
| Percent Change | -66.3% | -62.8% | -67.6% | -63.7% | -68.0% | -57.0% | -63.3% |
| Source: DEED Local Area Unemployment Statistics | |||||||
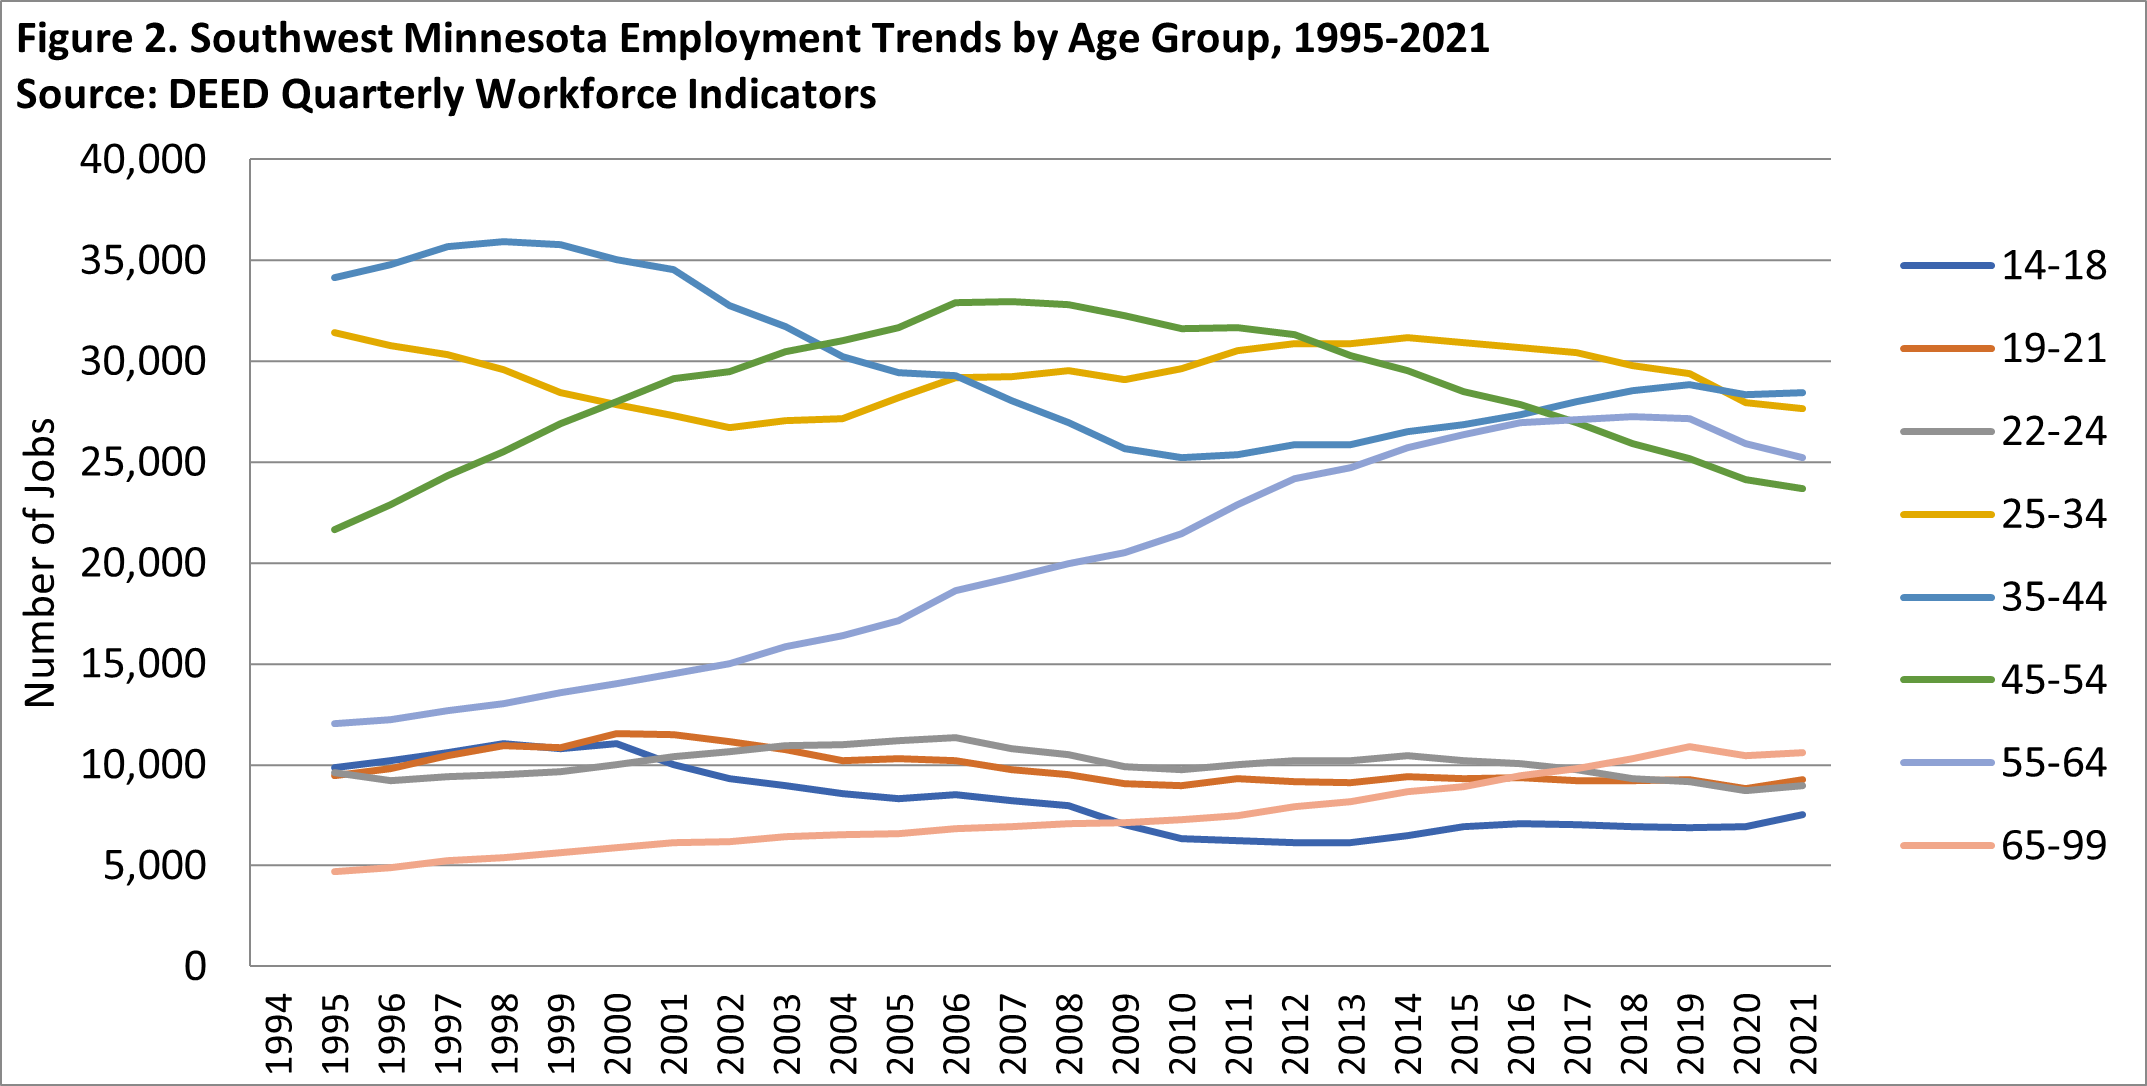
What might be driving these declines in labor force and unemployed individuals? One likely reason is the aging workforce and more older workers leaving the labor market during the pandemic, while there have not been enough younger workers to take their place. Data from Quarterly Workforce Indicators shows that there has been an interesting phenomenon going on in Southwest where employment numbers for older workers have increased over the years while those in younger age brackets have declined. In fact, the largest numeric and percent increases from 1995 to 2021 were seen in the two oldest age groups – up 13,165 jobs for 55- to 64-year-olds and up 5,874 jobs for the 65 and over group. Both groups more than doubled with 109.3% and 124.6% gains, respectively (see Figure 2).
However, these proportional increases in the two oldest categories in Southwest were much lower than those seen in the state as a whole, where there was a 168.4% increase in 55- to 64-year-olds and 212.8% increase in employment numbers for those ages 65 and over. This also means that older workers may be staying in the labor market longer, which will benefit employers as they not only continue to face labor force challenges, but can also benefit from the workplace knowledge that older, experienced workers have and can share with the up-and-coming workforce.
On the other hand, the largest numeric losses in the region were seen among 25- to 34-year-olds, which dropped by 3,763 jobs and 35- to 44-year-olds which declined by 5,722 jobs. However, the largest proportional drop was experienced by the youngest age category – those ages 14 to 18 – which decreased by almost one-quarter (23.7%) compared to a drop of only 7.6% in this age group statewide. See Figure 2.
Along with shifts in employment by age, there have also been some drastic changes in the workforce by race and ethnicity as the workforce has gotten more diverse over time. While the number of jobs held by white workers increased by just over 1,100 over the past 25 years, the number of jobs held by workers of other races climbed by more than 7,200, and the number of jobs held by workers who reported Hispanic or Latino origin jumped by 8,800 (see Table 2).
| Table 2. Southwest Minnesota Employment Trends by Race and Ethnicity, 1995-2021 | |||||||
|---|---|---|---|---|---|---|---|
| - | White | Black or African American | American Indian or Alaska Native | Asian | Native Hawaiian or Other Pacific Islander | Two or More Races | Hispanic or Latino |
| 1995 | 129,736 | 688 | 428 | 510 | 46 | 498 | 3,397 |
| 2000 | 138,669 | 1,336 | 630 | 1,932 | 63 | 703 | 5,549 |
| 2005 | 137,530 | 1,807 | 560 | 2,160 | 86 | 759 | 7,549 |
| 2010 | 133,862 | 2,235 | 583 | 2,517 | 119 | 918 | 7,862 |
| 2015 | 139,296 | 3,343 | 757 | 3,019 | 152 | 1,359 | 9,791 |
| 2019 | 136,312 | 4,252 | 858 | 3,428 | 206 | 1,714 | 11,394 |
| 2020 | 131,016 | 4,188 | 841 | 3,310 | 185 | 1,709 | 11,510 |
| 2021 | 130,849 | 4,186 | 884 | 3,339 | 205 | 1,801 | 12,210 |
| 1995-2021 Change | +1,113 | +3,489 | +456 | +1,829 | +159 | +1,303 | +8,813 |
| 1995-2021 % Change | +0.9% | +507.1% | +106.5% | +121.1% | +345.7% | +261.6% | +259.4% |
| Minnesota | |||||||
| 1995-2021 Change | +162,563 | +113,286 | +4,306 | +97,815 | +2,161 | +31,651 | +96,359 |
| 1995-2021 % Change | +8.8% | +216.9% | +30.1% | +236.5% | +241.7% | +200.7% | +266.8% |
| Source: DEED Quarterly Workforce Indicators | |||||||
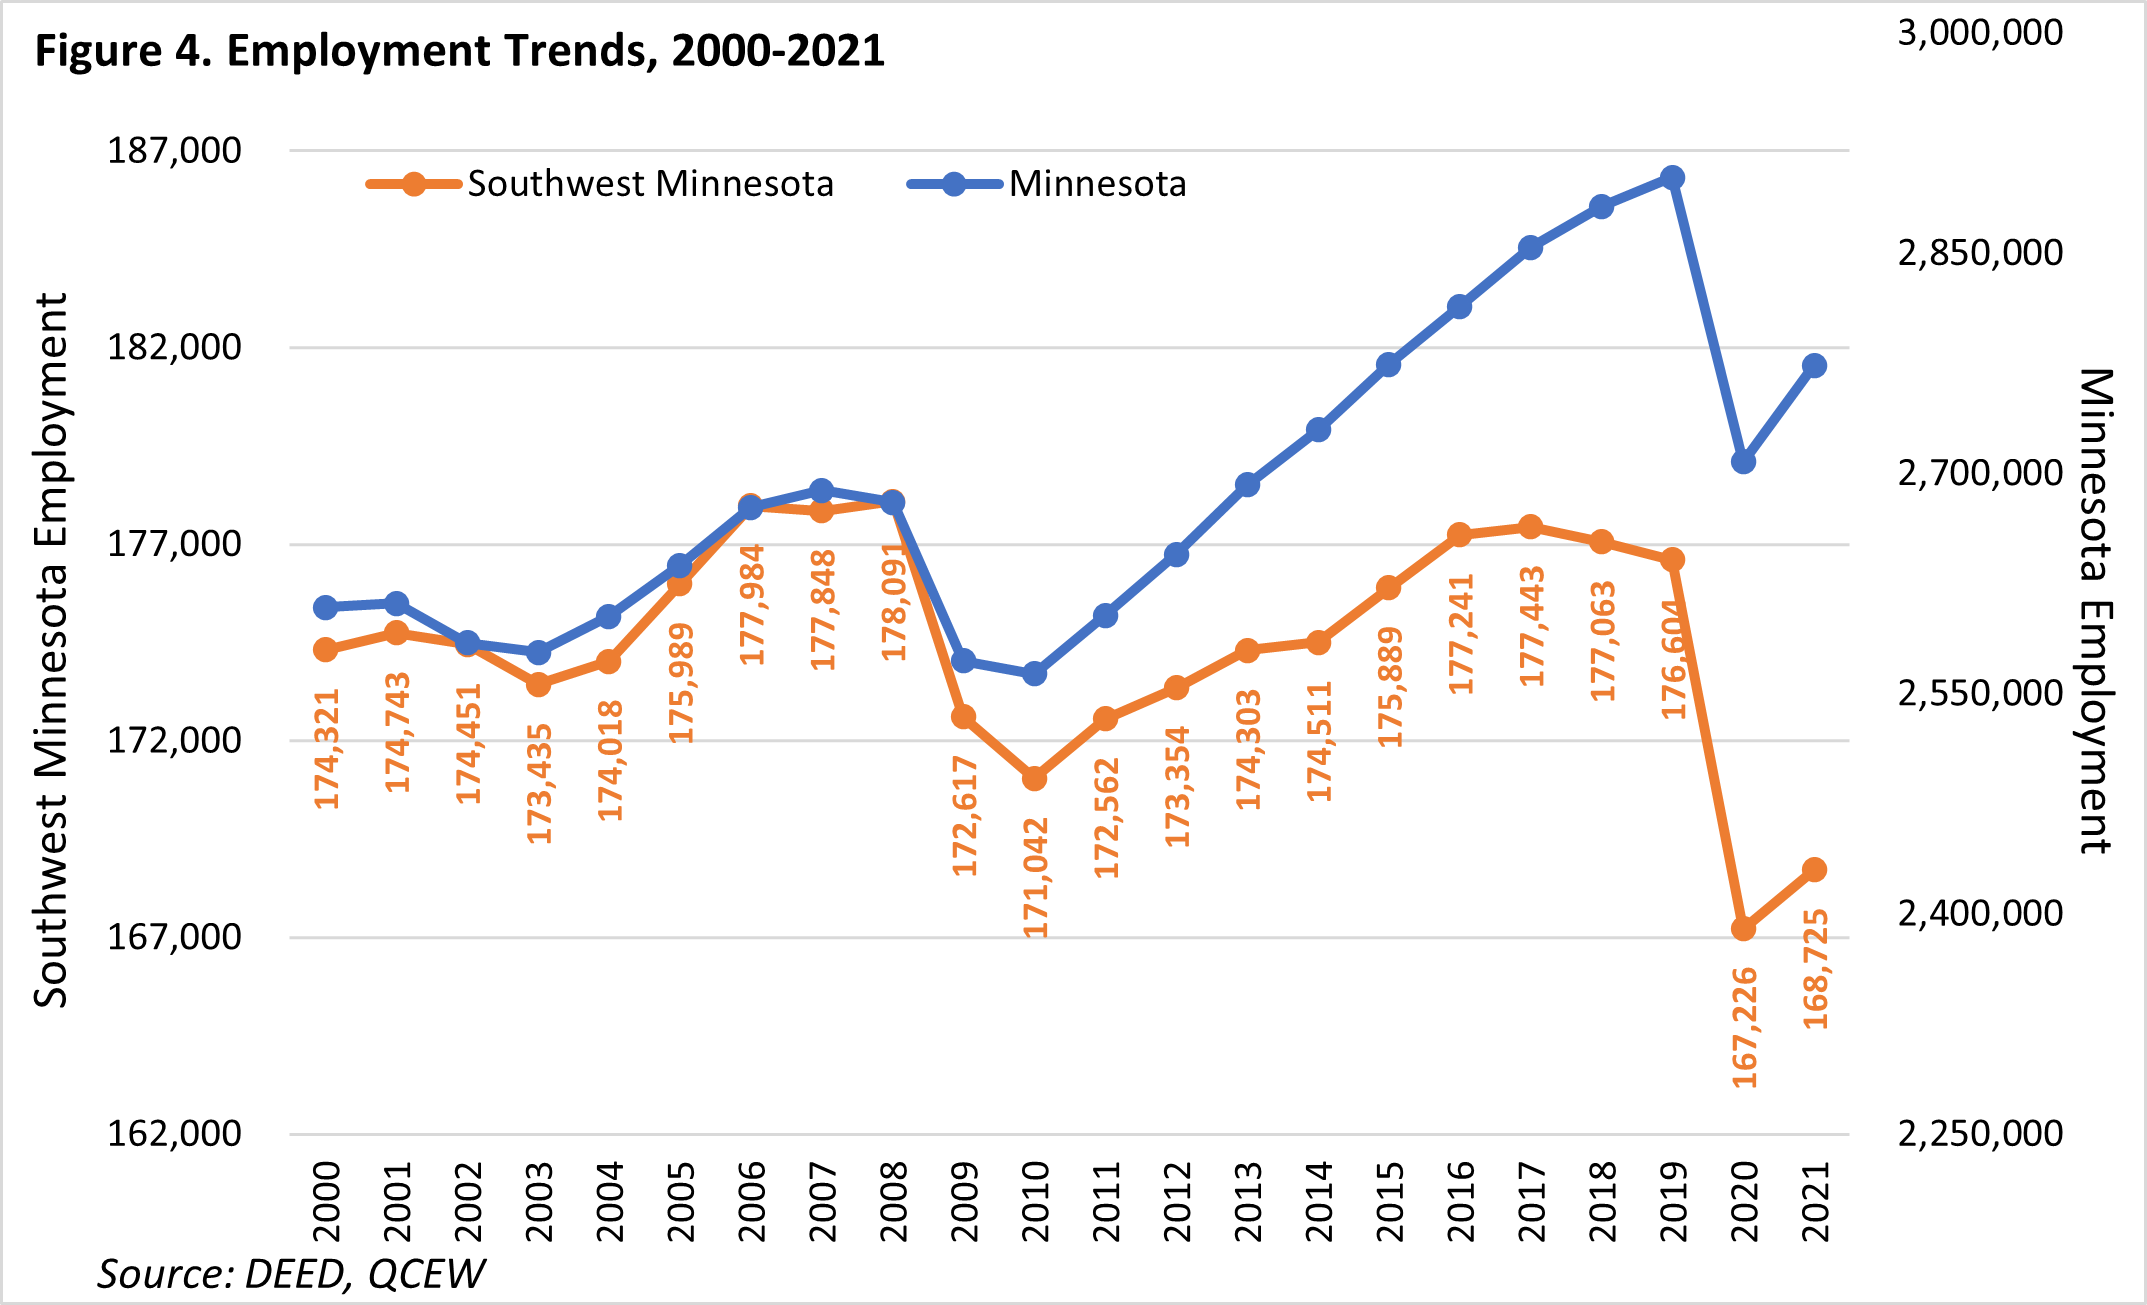
Even before the pandemic recession, Southwest still had not fully recovered all the jobs lost during the Great Recession. In fact, peak employment in the region over the past two decades actually occurred in 2008 with 178,091 jobs. After struggling with much slower than statewide growth rates, the region nearly recovered employment by 2017 with 177,443 jobs, but then was slowly sliding backward again until the pandemic outbreak.
The good news is that employment declined at a slower rate in the region than the state in 2020, with a -5.3% decrease logged in Southwest and a -6.7% drop in Minnesota overall. The bad news is that Minnesota recovered jobs 2.7 times faster than Southwest in 2021. While employment managed to grow 0.9% in Southwest from 2020 to 2021, that was well behind the +2.4% growth rate recorded statewide. By 2021, Southwest Minnesota was down -7,879 jobs compared to 2019, and was still short by -9,366 jobs compared to 2008 (see Figure 4).
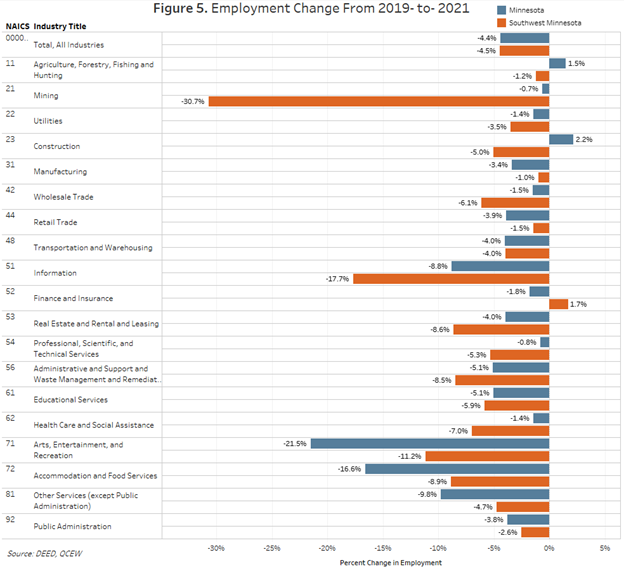
The largest job losses in the region were seen at Health Care & Social Assistance establishments, which shed -2,204 jobs from 2019 to 2021 for a 7% loss in employment. In percentage terms, the largest net loss over the past two years was in the Mining sector, but it only amounts to 98 fewer jobs since the industry is relatively small.
The Information industry also remains much lower than its pre-pandemic level, with 442 fewer jobs, or a -17.7% decline. Accommodation & Food Services had 1,087 fewer jobs in the region compared to 2019, for an -8.9% change in employment. Similarly, the Educational Services industry also lost nearly 1,000 jobs, representing a -5.9% decline.
Similar to other area across the state and country, Health Care & Social Assistance suffered substantial losses in 2020, however the employment in Southwest has not rebounded to the same extent as statewide, with 7% fewer jobs in 2021 compared to just 1.4% fewer jobs in Minnesota. Almost half of the region's job loss is concentrated in the Nursing and Residential Care Facilities subsector, where over 9% of jobs have vanished since 2019. Hospitals and Ambulatory Health Care Services fared the best, but still lost -4.2% and -5.8%, respectively.
Finance & Insurance was a bright spot as the lone sector that managed to gain employment during the two-year period. Losses at Credit Intermediation & Related Activities establishments were more than offset by a strong gain of 231 jobs at Insurance Carriers & Related Activities firms. On the net, this sector gained 100 jobs, which pales in comparison to the 2,204 job losses in the Health Care & Social Assistance sector alone. As seen in Figure 5, the region still had substantial employment losses and they were spread across every sector except one.
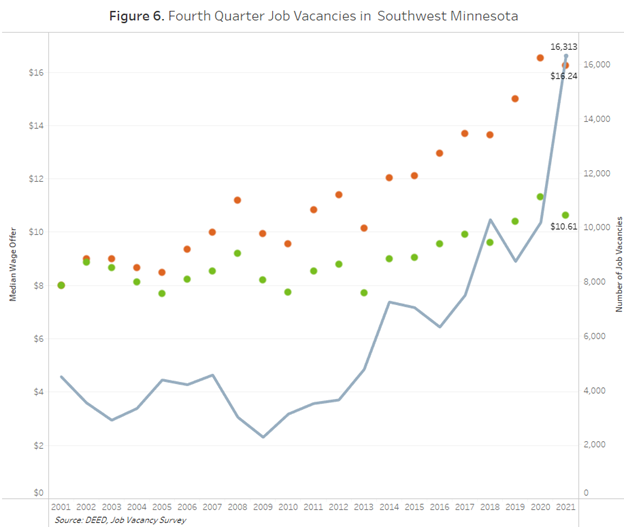
Perhaps more telling of the region's economy is the record numbers of job vacancies. In the fourth quarter of 2021, the region had roughly 16,300 vacancies, eclipsing the pre-pandemic peak by more than 6,000 vacancies. With a job vacancy rate of 9.9%, Southwest has the highest job vacancy rate in the entire state. For every 100 filled jobs, there are 9.9 unfilled jobs.
This rate illustrates the problem of job growth and recovering employment in the region. Record numbers of job vacancies represents a healthy demand for workers, yet as they go unfilled it spells trouble for the long-term regional economy. Without large numbers of workers returning to the labor market or in-migration from other areas of the state, country and world, employment might not be able to recover employment for years. If employers could fill every current opening, the region's economy would be fully recovered and actually would exceed the previous employment peak by almost 7,000 jobs. There are more unfilled jobs in the region than ever – meaning that the region could be further along the road to recovery if it could find workers to fill these openings (Figure 6).
Even accounting for the record levels of current demand, Southwest is also projected to see job growth of nearly 7,700 new jobs over the next decade. DEED's Employment Projections through 2030 start with the recession-depressed job counts from 2020, and therefore some of the expected growth is actually remaining job recovery. However, even once the region gets back to pre-pandemic employment levels, there is expected to be some additional growth.
This includes faster gains in the industries that were hardest hit, including Arts, Entertainment & Recreation, Accommodation & Food Services and Other Services, which typically are not among the fastest growing industries in our 10-year forecasts. To that end, Health Care & Social Assistance is again expected to be the largest growing and one of the fastest growing industries, potentially accounting for just over one-third of total projected job gains through 2030.
Other industries that should see steady growth in the region include Educational Services, Manufacturing, Construction, Transportation & Warehousing, and Public Administration. In contrast, only four of the 20 main industries are projected to lose jobs over the decade, with the biggest decline predicted in Retail Trade as consumer behaviors continue to change, and on-going declines for self-employed and agriculture workers. Though relatively small, Information is expected to see the fastest decline, cutting 7% of employment from 2020 to 2030 (see Table 3).
| Table 3. Southwest Minnesota Industry Employment Projections, 2020-2030 | ||||
|---|---|---|---|---|
| Industry | Estimated Employment 2020 | Projected Employment 2030 | Percent Change 2020-2030 | Numeric Change 2020-2030 |
| Total, All Industries | 195,812 | 203,504 | +3.9% | +7,692 |
| Health Care & Social Assistance | 29,352 | 32,081 | +9.3% | +2,729 |
| Manufacturing | 30,107 | 30,719 | +2.0% | +612 |
| Self-Employed & Unpaid Family Workers | 21,926 | 21,257 | -3.1% | -669 |
| Retail Trade | 18,569 | 17,653 | -4.9% | -916 |
| Educational Services | 15,564 | 16,274 | +4.6% | +710 |
| Public Administration | 13,193 | 13,517 | +2.5% | +324 |
| Accommodation & Food Services | 10,089 | 12,268 | +21.6% | +2,179 |
| Wholesale Trade | 8,045 | 8,118 | +0.9% | +73 |
| Construction | 7,573 | 8,082 | +6.7% | +509 |
| Transportation & Warehousing | 7,385 | 7,817 | +5.8% | +432 |
| Other Services | 6,756 | 7,462 | +10.4% | +706 |
| Finance & Insurance | 6,780 | 6,921 | +2.1% | +141 |
| Agriculture, Forestry, Fishing & Hunting | 5,674 | 5,753 | +1.4% | +79 |
| Professional & Technical Services | 3,788 | 4,006 | +5.8% | +218 |
| Admin. Support & Waste Mgmt. Services | 3,421 | 3,636 | +6.3% | +215 |
| Arts, Entertainment, & Recreation | 1,655 | 2,114 | +27.7% | +459 |
| Information | 2,152 | 2,001 | -7.0% | -151 |
| Management of Companies | 1,495 | 1,506 | +0.7% | +11 |
| Real Estate & Rental & Leasing | 1,318 | 1,311 | -0.5% | -7 |
| Utilities | 713 | 735 | +3.1% | +22 |
| Mining | 257 | 273 | +6.2% | +16 |
| Source: DEED 2020-2030 Employment Outlook | ||||
In summary, labor force constraints are clearly becoming the biggest limiting factor to economic growth in Southwest Minnesota. Without more workers in the labor force, it's possible that peak employment for the foreseeable future remains in the past. However, the region has welcomed increasing age and racial diversity over the past two decades, and will need to continue to bring more and new workers into the labor force to meet these challenges.