by Luke Greiner
June 2019
It’s been a powerhouse of growth, but is a slowdown on the horizon?
The fastest growing region of the state since the turn of the century, Central Minnesota is now home to more than 715,000 people, making it the largest region outside of the Twin Cities metro area. The rapidly expanding population has provided for substantial labor force growth, including nearly 63,000 new workers since 2000. In spite of having the state’s fastest labor force growth, organizations and human resource managers are now finding workers in scarce supply. The economy is showing few signs of slowing but continued growth depends on the ability of employers to fill open positions.
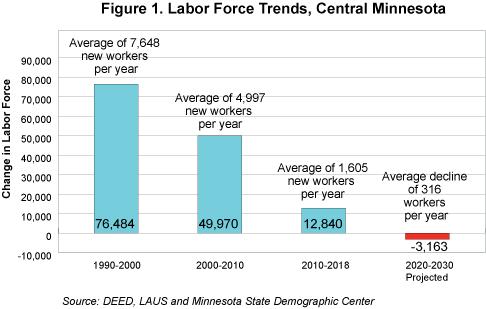
The story of baby boomers exiting the labor market is still being written, but few surprises are left. Projections have been predicting this demographic shift for decades. The net impact is a significant slowdown in labor force growth, with some unprecedented challenges in the near future. Since 2010, Central Minnesota’s labor force saw net gains averaging just 1,605 new workers per year. Considering growth the previous two decades was over three times faster, it’s no wonder that employers are struggling to adjust (Figure 1).

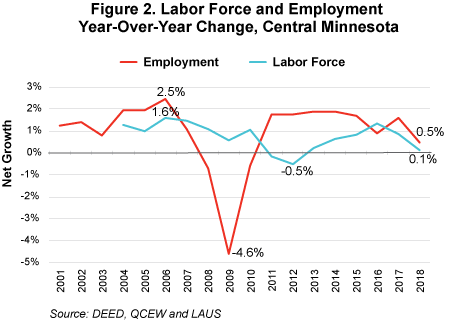
In fact, Central Minnesota’s labor force is expected to decline between 2020 and 2030, the first time in modern history. The most recent year’s data signal the transition with a net increase of just 539 workers from 2017 to 2018, a 0.1 percent rise. Lackluster labor force growth is constraining employers’ ability to expand and add jobs (Figure 2).

The relationship between Central Minnesota’s employment and labor force is moving closer to equilibrium. Of course, the nuance is the “going rate” or wage offer – individuals will respond to changes in the going rate differently, and if there’s room for employers to sweeten the pot considering how slowly wages have risen, more people may join the labor force. After adjusting for inflation, data show that median wage offers for all job vacancies have only risen modestly, about three cents from 2017 to 2018, for example. At the bottom of the recession in 2009 the inflation-adjusted median wage offer dropped to $7.72 in 2001 dollars, but has since risen to $10.42 in 2001 dollars, the highest on record.
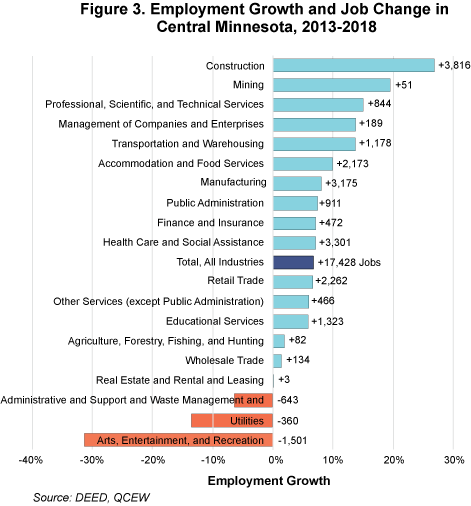
Central Minnesota’s employment growth in the last five years has been faster than any other region outside of the Twin Cities. Construction – oftentimes a leading indicator of the economic condition of a region – is painting a rosy picture of the economy. From 2013 to 2018, construction employment has grown by an astounding 26.8 percent in the region, faster than any other region and significantly faster than statewide.
From 2013 to 2018, all but three industry sectors expanded their payrolls in the region, with the largest job additions in construction, health care and social assistance, and manufacturing. Substantial declines in arts, entertainment and recreation1, utilities, and administrative support/waste management contributed a combined loss of 2,504 jobs, but were more than offset by gains elsewhere for net growth of 17,428 jobs (Figure 3).

After consistently leading the state in growth, Central Minnesota’s economy grew just 0.5 percent in the most recent year, slightly slower than either the Twin Cities, Northeast or Southeast Minnesota. Manufacturing, retail trade and construction all enjoyed strong job gains, while accommodation and food services, information and professional and technical services all lost more than 100 jobs. Overall, nine of the 20 industry sectors lost jobs from 2017 to 2018. This is far from a trend given the short time period, but it begs the question: Is there trouble on the horizon?
While employer sentiment and most data do not indicate any change in the current direction of the economy, Central Minnesota was not alone in experiencing declines in that period. A number of the same industries cut jobs across the state. Within regions, 11 of the 20 major sectors shed jobs in Northeast Minnesota, 12 in Northwest, five in the Twin Cities, nine in Southeast, and 14 in Southwest Minnesota. Still, only Northwest and Southwest Minnesota saw overall employment declines.
The distinguishing industries2 in Table 1 provide a more detailed look at the specialization of Central Minnesota’s economy. Synergy within these industries often occurs in the training of labor, supply chain infrastructure and networks, as well as support industries that can benefit from a large concentration of similar types of businesses. The synergy that helps current businesses in these industries expand also attracts newcomers, looking to capitalize on previous work and partnerships.
| Table 1. Central Minnesota Distinguishing Industries, 2018 | ||||||||
|---|---|---|---|---|---|---|---|---|
| Industry Title | Establishments | Employment | Location Quotient | Median Wage | Employment Change 2013-2018 | Projected Change 2016-2026 | ||
| Total, All Industries | 17,920 | 276,231 | 1.0 | $17.53 | 6.7% | +17,428 | 8.6% | 26,629 |
| Furniture and Related Product Manufacturing | 103 | 2,759 | 3.0 | $20.63 | 13.4% | +326 | 7.2% | +195 |
| Paper Manufacturing | 10 | 2,195 | 2.6 | $25.27 | 7.1% | +145 | 9.3% | +201 |
| Animal Production and Aquaculture | 177 | 2,671 | 2.6 | $14.35 | -2.1% | -56 | -21.5% | -533 |
| Transportation Equipment Manufacturing | 37 | 2,609 | 2.5 | $17.83 | -0.2% | -04 | 8.6% | +241 |
| Nonmetallic Mineral Product Manufacturing | 80 | 2,238 | 2.3 | $20.43 | 0.4% | +08 | 4.5% | +97 |
| Support Activities for Agriculture and Forestry | 92 | 500 | 2.1 | $15.89 | 42.0% | +149 | 35.0% | +167 |
| Heavy and Civil Engineering Construction | 206 | 4,550 | 2.1 | $29.37 | 18.7% | +717 | 35.1% | +1,416 |
| Gasoline Stations | 347 | 4,718 | 1.9 | $11.48 | 30.0% | +1,088 | 15.2% | +627 |
| Food Manufacturing | 102 | 8,580 | 1.9 | $16.91 | 14.1% | +1,062 | 3.0% | +233 |
| Beverage and Tobacco Product Manufacturing | 20 | 500 | 1.9 | $20.94 | 27.0% | +149 | 32.7% | +213 |
| *Median wage is the average of first two quarter median wages
Source: DEED, QCEW and QED |
||||||||
Recent employment and projected trends are generally positive for the top 10 distinguishing industries in Central Minnesota, with only animal production expected to decline by 2026, likely a result of automation and increased efficiency. Common economic development strategies include boosting the number of jobs in high paying industries that are likely to continue growing, and half of the industries in Table 1 have median wages that top $20 per hour.
The region averaged almost 15,000 job vacancies during the two survey periods in 2018, the largest number ever recorded. The low rate of unemployment coupled with the high number of vacancies means there was less than one unemployed person for each opening. In contrast, during 2009 there were 12.6 unemployed workers for every vacancy.
Aside from large numbers of openings, a telling translation of how openings impact the job market is the job vacancy rate (see Table 2). Job vacancy rates are the ratio of openings to current employment, so the overall job vacancy rate of 5 percent in the region means that roughly 5 percent of current jobs are unfilled. Job seekers are finding opportunity in a broad range of occupational categories: eight of the 22 occupational categories have record job vacancy rates in 2018. Rates rise when the growth of vacancies outpaces employment, another clear example of a tight labor market potentially constricting employment growth.
With employment growth increasingly linked to labor force growth, Central Minnesota's economy could be on track to slow down, or fall more closely in line with the rate of labor force growth. However, it's unknown how many people on the sidelines would join the labor force if wages increase. What is certain is that workers matter – their compensation, attitude, and productivity is on the minds of employers who can't afford to leave any stone unturned.
| Table 2. Central Minnesota Job Vacancy Trends | ||||
|---|---|---|---|---|
| - | 2018 Job Vacancies | |||
| Vacancies | Median Wage Offer | Requiring Post-Secondary Education | Job Vacancy Rate | |
| Total, All Occupations | 14,888 | $14.08 | 27% | 5% |
| Management | 225 | $31.97 | 64% | 2% |
| Business and Financial Operations | 147 | $25.18 | 77% | 2% |
| Computer and Mathematical | 244 | $26.56 | 86% | 6% |
| Architecture and Engineering | 147 | $22.24 | 78% | 3% |
| Life, Physical, and Social Science | 50 | $24.46 | 99% | 3% |
| Community and Social Service | 229 | $19.58 | 68% | 4% |
| Legal | 28 | $23.16 | 93% | 3% |
| Education, Training, and Library | 640 | $18.61 | 89% | 3% |
| Arts, Design, Entertainment, Sports, and Media | 115 | $16.19 | 40% | 5% |
| Healthcare Practitioners and Technical | 776 | $25.03 | 92% | 5% |
| Healthcare Support | 598 | $13.92 | 38% | 6% |
| Protective Service | 139 | $12.25 | 24% | 4% |
| Food Preparation and Serving Related | 2,366 | $11.02 | 5% | 16% |
| Building and Grounds Cleaning and Maintenance | 702 | $12.34 | 4% | 9% |
| Personal Care and Service | 1,160 | $11.74 | 19% | 8% |
| Sales and Related | 2,069 | $12.32 | 2% | 7% |
| Office and Administrative Support | 1,160 | $13.15 | 13% | 3% |
| Farming, Fishing, and Forestry | 162 | $9.84 | 1% | 35% |
| Construction and Extraction | 641 | $21.65 | 20% | 5% |
| Installation, Maintenance, and Repair | 1,014 | $19.11 | 52% | 9% |
| Production | 1,059 | $14.37 | 14% | 3% |
| Transportation and Material Moving | 1,064 | $16.42 | 8% | 5% |
| *Job vacancy data is a weighted average of two periods, Source: DEED, JVS | ||||
1Casinos with hotels were reclassified to a code in the accommodation and food industry. No employment was lost in the region.
2Designated by a location quotient (LQ) above 1. LQs are a measure of how concentrated an industry is in a region compared to the state as a whole. An LQ of 1.0 means that the share of employment in a particular industry in a local economy is exactly the same as its share statewide. An LQ greater than 1.0 means the local share of employment in the industry exceeds the state share.