by Dave Senf
January 2021
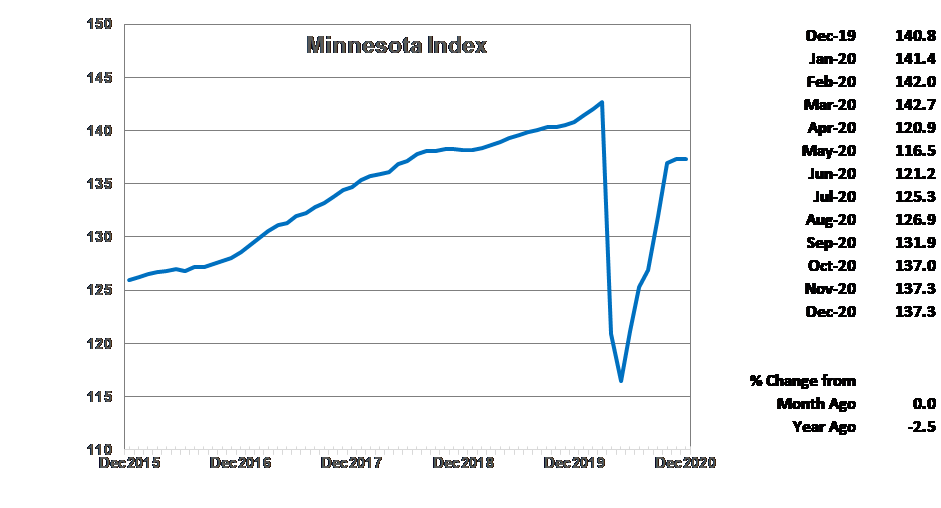
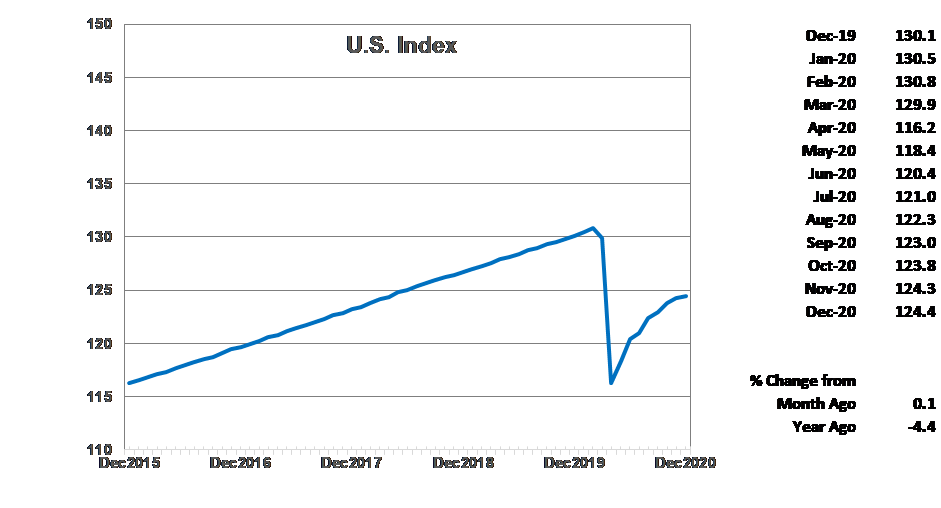
The Minnesota Index was basically flat in December after having increased for six straight months. The spike in COVID-19 cases in November and December led to state restrictions on the hospitality industry and another round of layoffs, especially at Minnesota eating and drinking places. The U.S. Index increased 0.1% for the second month in a row. Economic growth in Minnesota, as measured by the index, increased faster than the U.S. growth from June to October but has slipped slightly behind the nation over the last two months.
December's stagnant index was caused by a steep drop in wage and salary employment and a small decline in average weekly manufacturing hours. Minnesota's unemployment rate declined for the seventh consecutive month, inching down to 4.4% from 4.5% in November. The improved unemployment rate, however, is from individuals leaving the labor force rather than securing employment. Minnesota's labor force participation rate was 67.5% compared to the U.S. 61.5% rate in December. Labor force participation rates haven't been this low in over 45 years.
Minnesota's index is down 2.5% from a year ago while the U.S. index is down 4.4% over the year. Minnesota's economic pie, as measured by the index, is 3.8% smaller than its peak in March while the U.S. index is 4.9% behind its peak reached in February. Based on state coincident indices (which is what the Minnesota Index is) 13 states, led by Utah, Nebraska, and Delaware, had higher GDP in December than in March when the pandemic took hold. Minnesota has the 32nd largest GDP gap for the same period, with the state's level of economic activity 3.8% less in December than in March. Hawaii and Massachusetts had the largest March to December falloffs at 15.7% and 11.3%. Iowa's economy was 0.5% above its March level, while South Dakota was 0.5% lower, Wisconsin 4.5% lower, and North Dakota 7.5% lower.
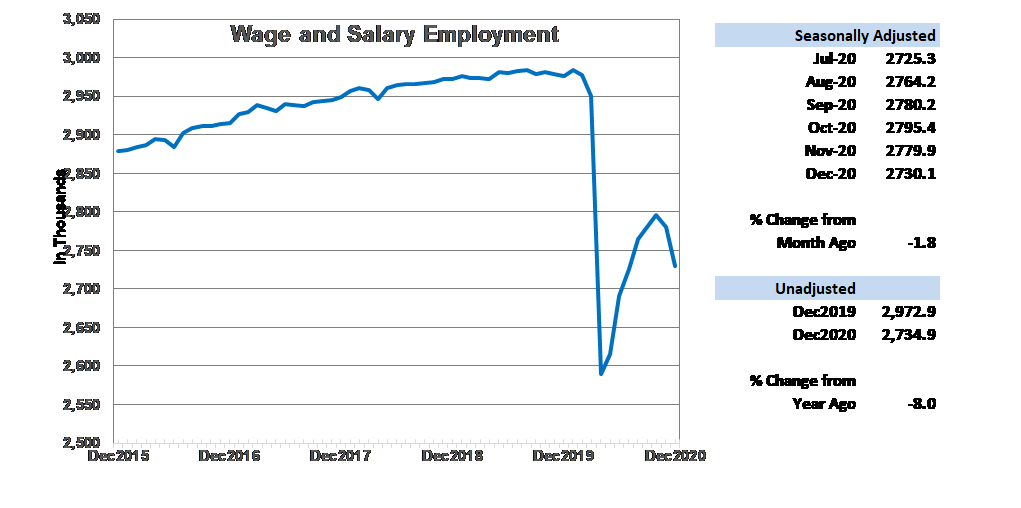
The recent second wave of COVID-19 cases put the brakes on the six-month Wage and Salary Employment rebound in Minnesota with employment tailing off in November and then plunging in December. Employment dropped 0.6% in November and then 1.8% in December. U.S. employment declined for the first time since May dipping 0.1%. Minnesota job growth was stronger than nationwide during the previous four months but fell behind over the last two months. The recent job loss translates into Minnesota's having recovered roughly 36.2% of the 387,800 jobs lost in March and April through December while nationally 55.6% of the 22.2 million jobs lost across the nation in March and April have been recovered.
Most of the employment loss in December was concentrated in Leisure and Hospitality as a result of restrictions put on restaurants and bars. Four other sectors cut their workforces with Government, Other Services, and Education and Health Services recording job reductions. Trade, Transportation, Utilities, Manufacturing, and Professional and Business Services added the most jobs. The Goods-producing sector added jobs for the sixth month of the last eight in December while Service-providing sector employment dropped for the second month in a row. The pandemic recession, which ended in May or June, was concentrated in the service side of the economy unlike past recessions.
Minnesota's unadjusted employment in December was down 8.0% or 238,000 jobs from a year ago. Unadjusted employment nationwide was 6.0% below 12 months ago or roughly 9.2 million jobs. Idaho (0.7%) and Utah (0.6%) were the only states with higher wage and salary employment in December 2020 than December 2019. Hawaii and Michigan had the highest year-over-year drop off, 13.5% and 10.8%. Minnesota's 8.0% over-the-year decline was the 8th largest. South Dakota's over-the-year decline was 2.7%, Iowa's was 4.2%, North Dakota's was 6.5%, and Wisconsin's 6.9%.
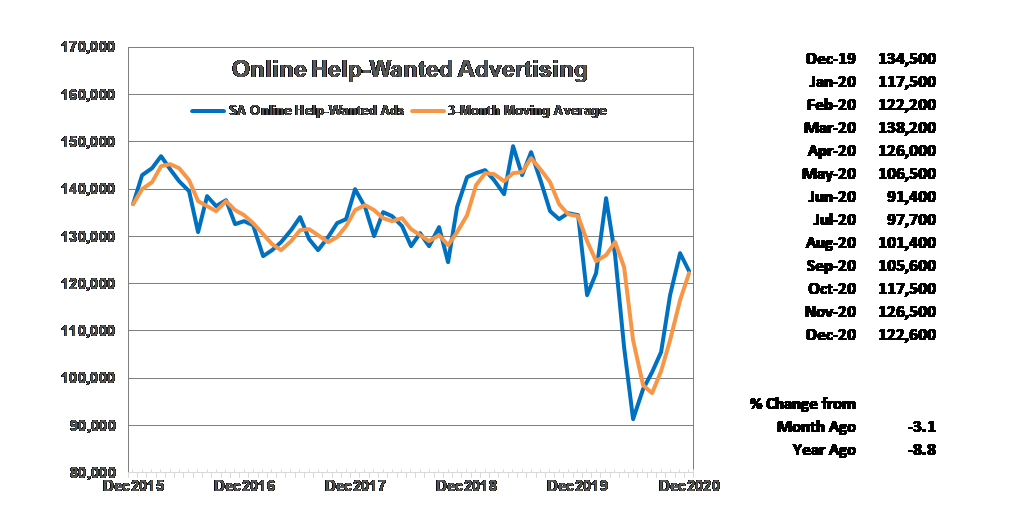
Online Help-Wanted Ads slipped for the first time in six months in December, tailing off to 122,600. Online job postings nationally increased 1.2% while Minnesota's drop was 3.1%. Online help-wanted ads in the state are down 11.3% between March and December compared to a 3.9% drop nationwide over the same period. Minnesota's share of U.S. online job postings slipped to 2.1%, indicating that demand for labor in Minnesota is running behind most other regions of the U.S. Minnesota's lower labor demand relative to the U.S. is reinforced by online job postings in Minnesota in December being 8.8% below a year ago while nationally job postings are up 11.3% from last December.
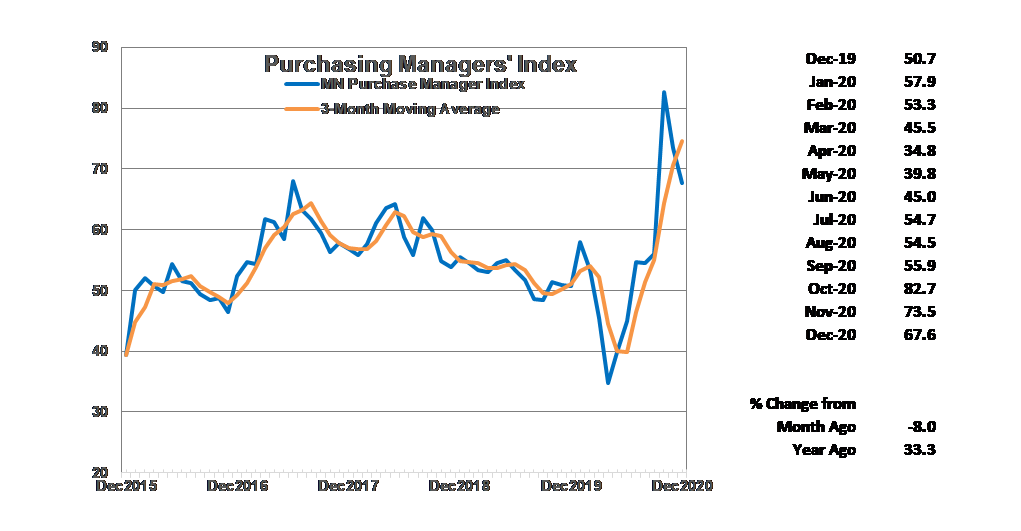
Minnesota's Purchasing Managers' Index (PMI) recorded its second straight decline in December after having set a record-high in October. December's 67.6 reading is still robust by historical standards as the 26-year average for the index is 54.1. The robust reading indicates that Minnesota's manufacturing sector will continue to pick up speed over the next few months. The index ranges from 0 to 100 percent with a reading above 50 indicating expansion over the next six months.
The national ISM Manufacturing Index accelerated to 60.7 in December while the Mid-America Business Index tailed off to 64.1. Both indices are similar to the Minnesota PMI. Minnesota manufacturers, at least in December, were more optimistic about expanding manufacturing activity than their counterparts in other parts of the nation.
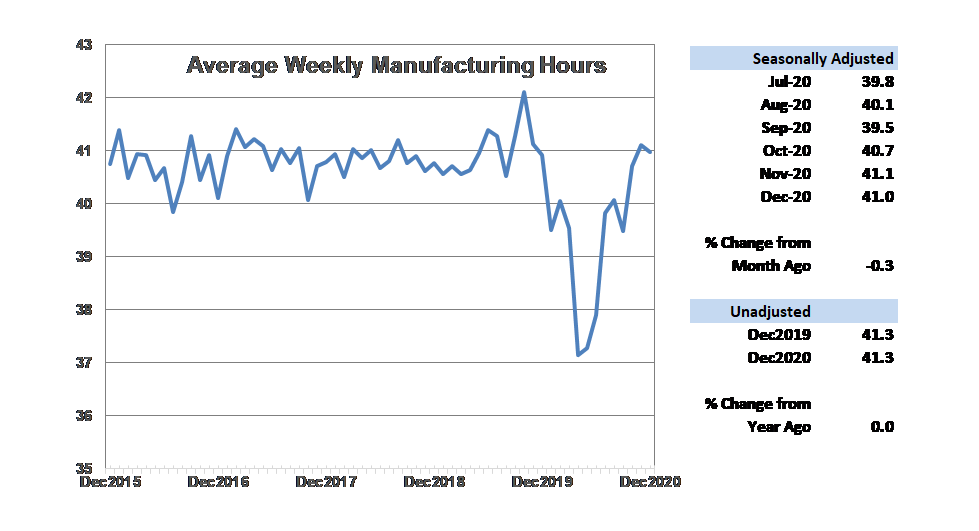
Average weekly Manufacturing Hours inched down to 41.0 after having increased strongly over the previous two months. The 41.0-hour workweek is slightly above the 50-year average of 40.5 hours. The solid factory workweek is consistent with Minnesota's healthy PMI index. Manufacturers added 1,300 jobs in December, bringing the total of manufacturing jobs added since May to 10,500. That is roughly 46% of the manufacturing jobs lost in March and April.
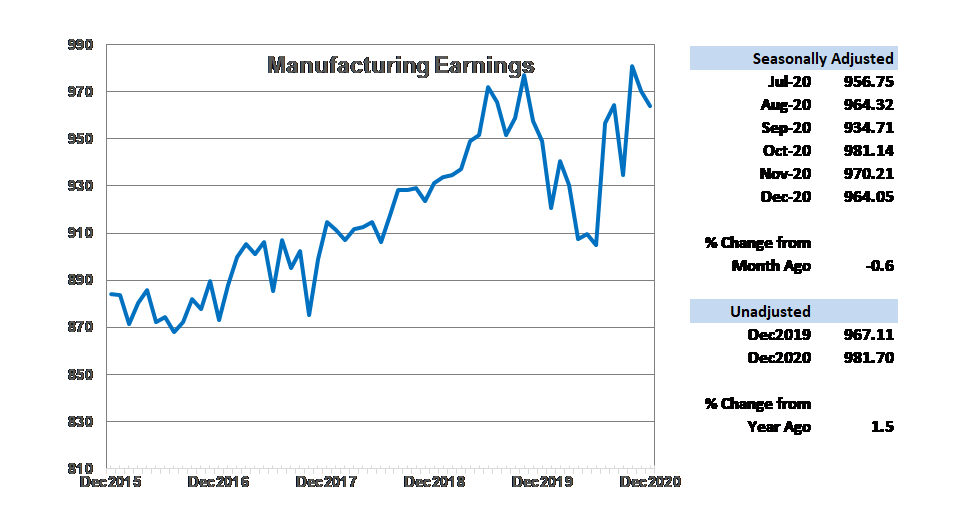
Average weekly Manufacturing Earnings tailed off for the second straight month, declining 0.6% to $964.05 but remain near record levels. Weekly manufacturing earnings were up 1.5% in real terms compared to last December, but real annual average weekly factory paychecks were 1.3 percent lower in 2020 than in 2019 as weekly paychecks tumbled when the pandemic reduced manufacturing employment and hours worked from March to June.
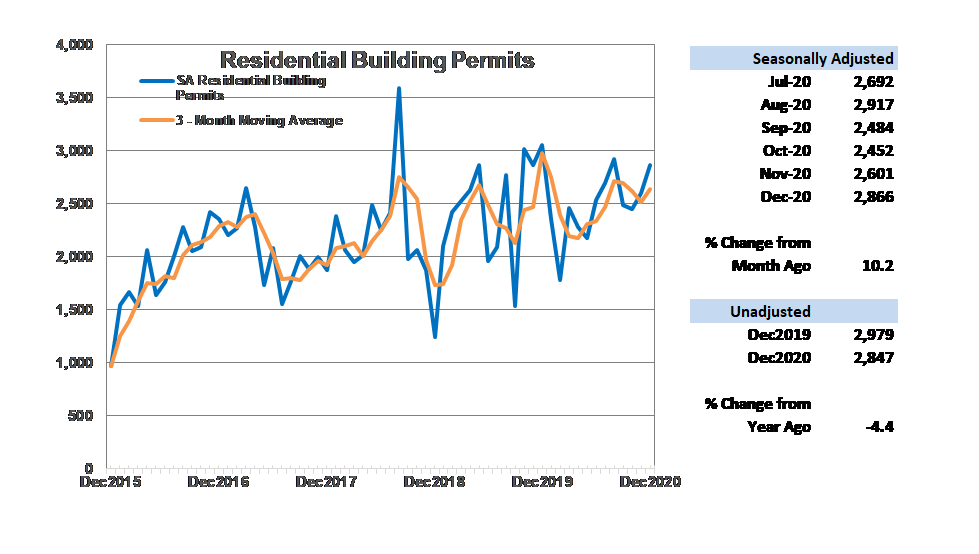
Adjusted Residential Building Permits bumped up for the second month in a row as home building activity closed out the year on a strong note. December's 2,866 permits brought total unadjusted permits to 29,804 for the year which was just 0.1% below home building permits in 2019. Residential building permits in the state accounted for 2.1% of nationwide permits for the year which is slightly higher than the state's 1.7% of U.S. population. Solid homebuilding activity was a positive surprise in 2020 as residential building usually falls before and during a recession. A low inventory of existing homes for sale plus record low mortgage rates boosted home building activity in Minnesota and nationally throughout the year despite massive job loss and a record unemployment rate brought on by the pandemic.
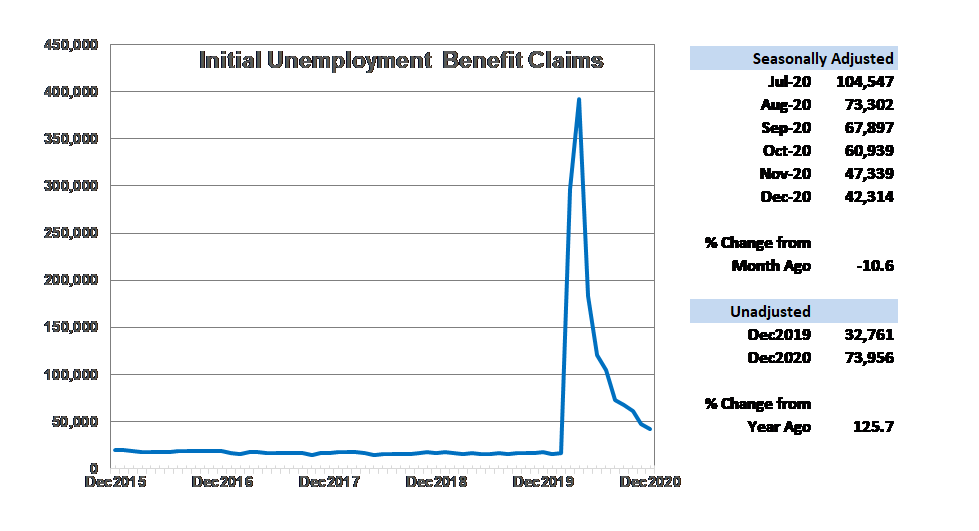
Adjusted Initial Claims for Unemployment Benefits (UB) declined for the eighth month in a row after skyrocketing to record heights back in March and April as the pandemic set in. Initial claims declined 10.6% in December despite the reinstatement of restrictions on Minnesota eating and drinking establishments The level of initial claims was 2.6 times higher than last December's level as workers continue to be laid off at rates significantly above pre-pandemic levels. A total of 1.4 million initial claims for benefits were recorded in 2020. That tops the previous record-high year of 2009 when 467,000 initial claims were recorded.
Note: All data except for Minnesota's PMI have been seasonally adjusted. See the feature article in the Minnesota Employment Review, June 2010, for more information on the Minnesota Index.
The Philadelphia Federal Reserve Bank, which produces the Minnesota Leading Index, has temporary suspended generation of state leading indices.