by Carson Gorecki
June 2023
Which Minnesota county has the highest concentration of Transportation Equipment Manufacturing employment? Which industry is most highly concentrated in Economic Development Region 9 – South Central? These are just a couple of the questions answerable via a new visualization available on DEED's Labor Market Information website. The Minnesota Location Quotient Tool utilizes Quarterly Census of Employment and Wages (QCEW) data to calculate the corresponding or county or regional Location Quotients (LQs).
LQs are a means of indicating a geography's concentration of a specific measure relative to a larger area that the chosen location is within. An industry's share of an area's total employment is divided by the industry's share of total employment of the larger area. The result is a ratio where a value less than 1.0 indicates lower than average concentration of that industry's employment in the sub-area, and a value larger than 1.0 indicates above average concentration of industry employment.
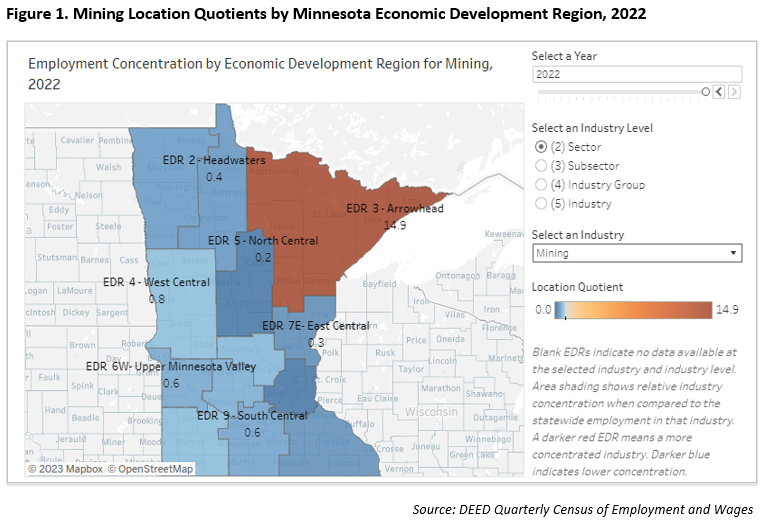
In this way, LQs are useful in that they can illuminate different economic strengths throughout the state. For example, a high Mining LQ (14.9) in Northeast Minnesota points toward unique conditions in the region that have attracted and fostered employment in that industry relatively more or better than in the rest of the state (see Figure 1). In this case, it is the location of iron-rich deposits in the region that give it competitive advantage. The tool also provides the ability to see how concentration changes over time. Since 2002 (LQ 13.1), Mining employment has become relatively more concentrated in Northeast.

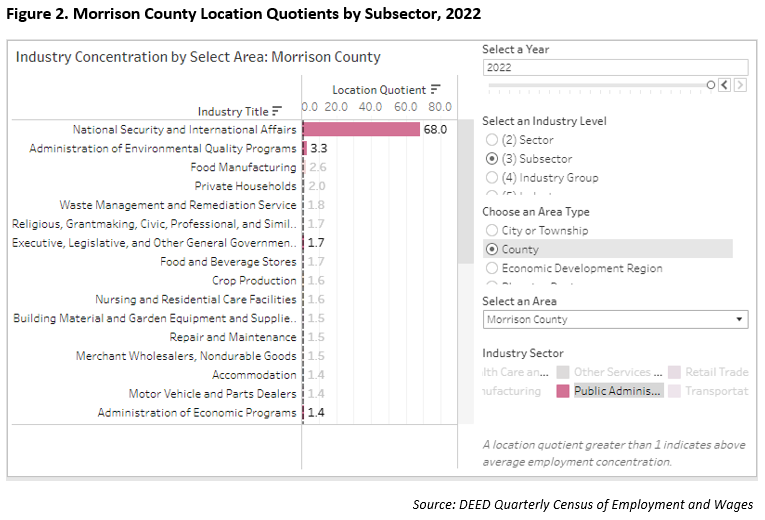
In addition to the ability to compare LQs across areas, the new tool also provides a view that compares LQs within a chosen area. This is a slightly different way to assess an area's relative economic strengths, allowing for comparisons of diverse sectors, industries, and subsectors. In Morrison County, for example, National Security & International Affairs was the subsector with the largest LQ (68.0) by a significant margin. This massive LQ is due in large part to the location of Camp Ripley, a large facility that trains members of the Minnesota National Guard among other military and civilian groups.
The color of the bars of each industry or subsector corresponds with the larger sector they fall under. By clicking the Public Administration sector in the legend in the bottom right of the tool, the industries within that sector are highlighted in the figure (see Figure 2).

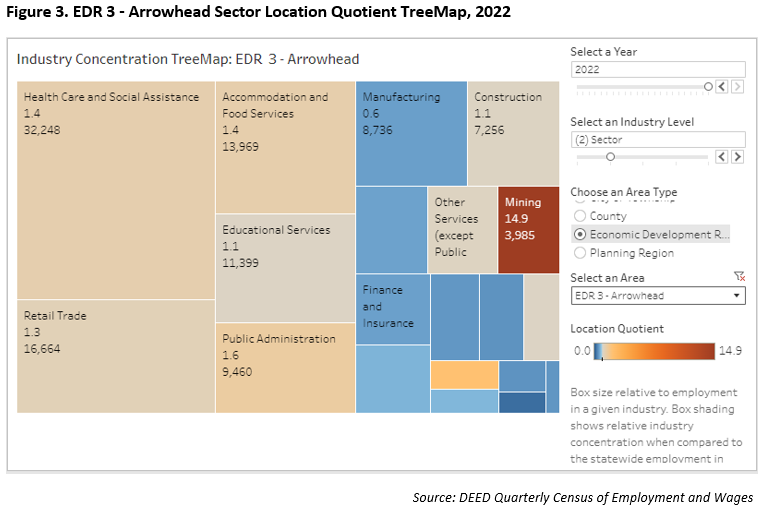
But LQs can be deceiving without context. Just because an industry or subsector is highly concentrated does not mean that it has the most jobs or is even a major employer at all. The Northeast Mining sector mentioned above is a good example. Despite being nearly 15 times as concentrated as the sector is statewide, the sector's employment was below 4,000 jobs out of a regional total of 134,000 jobs in 2022.
The TreeMap tab of the tool allows users to see both the LQ (rectangle color and shade) at the same time as the number of jobs (rectangle size). Users can also see what the average annual wage of an industry or sector is by hovering over it. The total number of jobs is important additional context for identifying the biggest industrial strengths. In Northeast, Mining is the most concentrated and highest-paying sector on average, but the 10th largest in terms of total employment (see Figure 3). The TreeMap allows for a more holistic view of industry employment concentration in an area.

Whether you are an economic developer, job counselor, researcher, or just a curious person, there are many ways to utilize the Minnesota Location Quotient Tool. The information needed to create these numbers exists in DEED's QCEW program, but the LQ tool simply repackages QCEW in a way that allows for useful comparisons. We hope you find it a helpful addition.