by Dave Senf
June 2016
Note: All data except for Minnesota’s PMI have been seasonally adjusted. See the feature article in the Minnesota Employment Review, May 2010, for more information on the Minnesota Index.
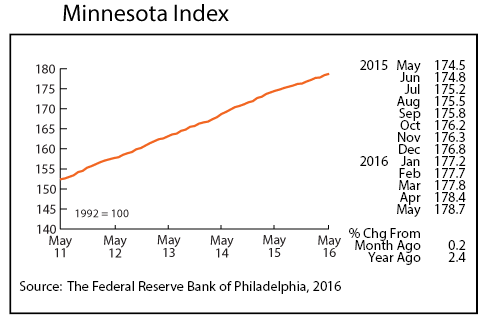
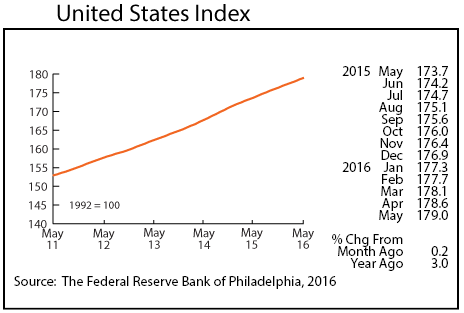
The Minnesota Index downshifted slightly in May, advancing 0.2 percent after increasing 0.3 percent in April. The only component of the index to increase was real wage and salary disbursements. The unemployment rate was unchanged while wage and salary employment and average weekly manufacturing hours slipped slightly. The U.S. Index also increased by 0.2 percent in May.
The U.S. Index was up 3.0 percent from a year ago while Minnesota’s index was up 2.4 percent over the same period. Economic growth in the state, as gauged by the Minnesota Index, has been slower than U.S. growth since the start of the year. Real GDP growth for Minnesota and the U.S., as reported by the Bureau of Economic Analysis (BEA), was 2.4 percent in 2015. Minnesota’s annual average increase in GDP since 2011 is 2.2 percent compared to 1.8 percent nationally.
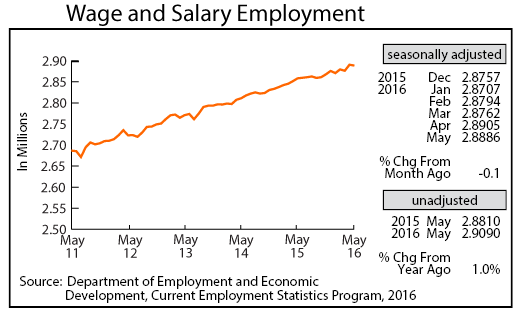
Adjusted Wage and Salary Employment, after surging in April, dropped by 1,900 positions in May. Private sector payroll numbers jumped by 14,400 in April but declined by 4,600 in May. Job loss in the private sector was partially offset by a gain of 2,700 public sector jobs with most of the hiring split between state and local government. Job losses were heavy in Manufacturing, Construction, Financial Activities, and Leisure and Hospitality. The only significant private sector hiring was in Educational and Health Services where 3,900 jobs were added.
Minnesota’s unadjusted over-the-year job growth slipped to 1.0 percent in May, the lowest over-the-year gain since March 2014. The U.S. over-the-year job growth tailed off to 1.7 percent in May, the lowest over-the-year gain since February 2014. The pace of job growth has slowed in Minnesota and nationally during first half of the 2016. Over-the-year job growth through May averaged 1.7 percent last year in Minnesota compared to this year’s 1.3 percent average.
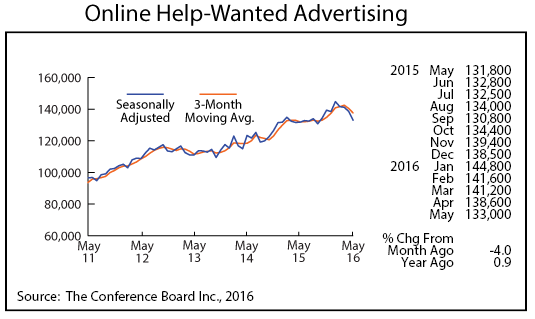
Online Help-Wanted Ads dipped for the fourth consecutive month in May, sliding to 133,000, the lowest level since last September. The online job advertising decline was 4.0 percent in Minnesota and 5.5 percent nationally in May. The recent downward trend in online help-wanted ads may, however, be partially caused by Craigslist’s increasing the price of job advertising which may be reducing job advertising.
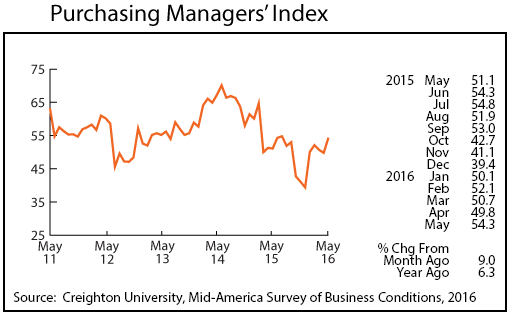
Minnesota’s Purchasing Managers’ Index (PMI) continues to send mixed signals. Minnesota manufacturers added 1,700 jobs in April when the PMI ticked in at 49.8. In May the index jumped to 54.3, its highest level in 10 months, yet manufacturing employment slipped by 2,300 jobs. Minnesota’s reading topped both the nine-state Mid-America Business Conditions Index (52.1) and the U.S. ISM (51.3). Manufacturing employment in the state has been flat during the first half of the year after increasing by 1.5 percent last year.
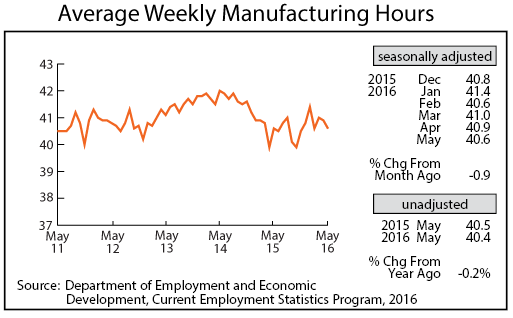
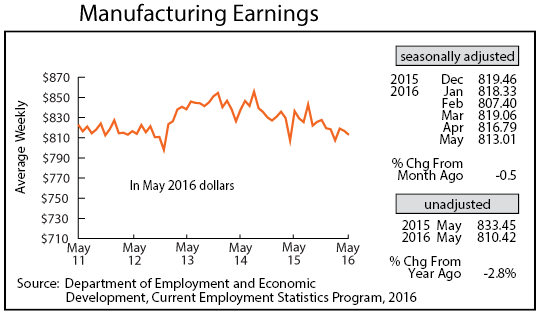
Adjusted Manufacturing Hours slipped for the second straight month in May, declining to 40.6. That is the same factory workweek averaged during 2015 but down significantly from the record 41.7 hour average in 2014. Average weekly Manufacturing Earnings stumbled for the second month in a row, tailing off to $813.01. Real factory paychecks are 2.8 percent lower than a year ago.
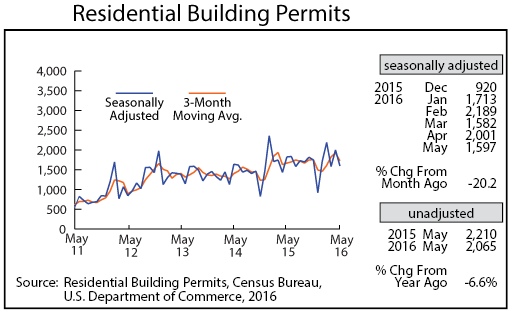
Adjusted Residential Building Permits zigzagged downwards to 1,597 in May. Permit numbers through the first five months this year are roughly the same as last year. More single-home permits are being issued, however, as apartment building activity slows after surging over the last three years. Residential building permits topped out around 40,000 in 2003 and then plunge to 8,000 in 2011. Homebuilders have gained ground over the last few years, but the home building recovery has been slow with 20,000 building permits issued in 2015. That permit level is still below the 25,000 annual average recorded over the last 35 years.
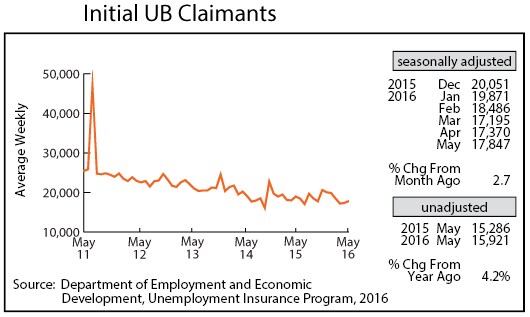
Adjusted Initial Claims for Unemployment Benefits (UB) rose for the second straight month but remained well below historical averages. May’s 17,847 initial claims is 0.6 percent of total wage and salary employment. The ratio of initial claims to employment has been lower only 4 percent of the time since 1970. Initial claims have been declining since 2010 as the state’s job market rebounded from the Great Recession. Claims declined by 4 percent in 2015 and are down 3 percent through the first five months of 2016 compared to last year. The low rate of layoffs associated with the ongoing low level of initial claims suggests that Minnesota job growth will remain positive but slowed by the tightening labor market.
