by Erik White
January 2015
Minnesotans don't need a calendar to announce the changing of the seasons. The formation of ice on lakes and its disappearance, the budding of leaves and their brilliant transformation before their fall, and even the incremental changes of daylight hours indicate the yearly cycle that distinguishes Minnesota. The turning of the season alters nature all around, and it also creates changes to the labor market and the local economy. This article focuses on the magnitude and relationship of these changes for Northeast Minnesota.
In order to examine the effects that seasons have on the regional economy, the months of January, February, and March were used to represent the winter season and the months of July, August, and September to make up the summer season. To get a seasonal estimate the average of the three months to the corresponding season were used. By comparing employment information from winter to summer, seasonal change can be measured and analyzed for trends over time.
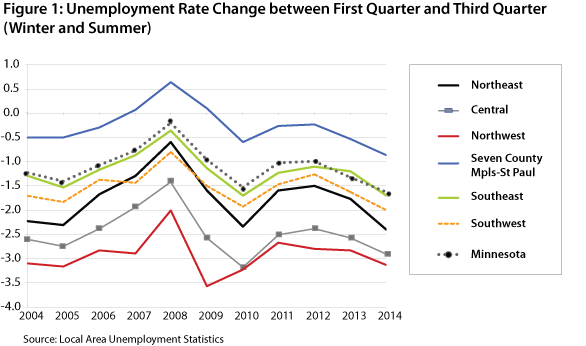
The unemployment rate is one indicator of economic activity, and Figure 1 shows the changes that occur from the first quarter to the third quarter for the six planning regions of Minnesota, according to data from DEED's Local Area Unemployment Statistics (LAUS). Since 2004 Northeast Minnesota's unemployment rate has dropped an average of 1.75 percent between the two seasons, a much greater change than that for the State of Minnesota, but less than the drop in unemployment for Northwest Minnesota.
The winters of Northern Minnesota may be viewed as harsh by the uninitiated, but by summer time the cabins are filled and the lakes are populated throughout the region, causing service industries to increase hiring to meet the demands of these seasonal residents and tourists. This feature, shared by Northeast and Northwest Minnesota, helps to explain the considerable drop in the unemployment rate from winter to summer (see Figure 1).

Much as we would include a measure of the wind to determine how cold it feels during a Minnesota winter day, so it's important we measure the changes in the overall labor force to determine the seasonal effect on the local economy. Since 2004 the average size of the labor force in Northeast Minnesota expanded 1.7 percent between the two seasons, as the average estimate for the winter labor force was 166,783 available workers compared to 169,569 workers during the summer.
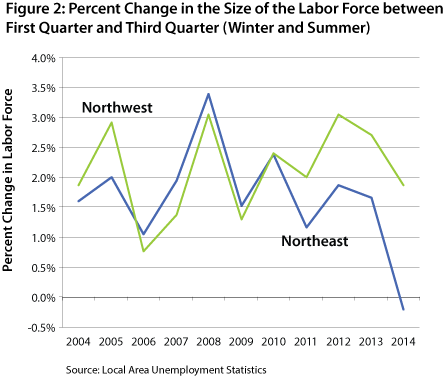
As Figure 2 shows, the pattern of seasonal fluctuations to the labor force for Northeast Minnesota is also shared with Northwest Minnesota, highlighting the seasonal variation for regions that are known as summer vacation destinations. Typically, the change from winter to summer causes Northeast Minnesota's unemployment rate to drop along with a corresponding increase to the labor force, but there are exceptions to this pattern.

In 2008, in the midst of the recession, Northeast Minnesota's labor force actually increased by 5,596 people, the greatest gain measured since 2004. At the same time, the number of unemployed fell from 11,486 in the winter to 10,766 in the summer, constituting the smallest drop since 2004. The large increase to the labor force and the small decrease in the number of unemployed workers led to high unemployment rates and generated just a 0.6 percent decrease between the two seasons.
As the recovery gained momentum in 2014, the trend for 2008 was completely reversed. The region's labor force contracted by 345 people from the winter to the spring, while the number of unemployed fell by 4,058 people. The large decrease of unemployed workers who were finding jobs coupled with the decrease in size of the labor force led to a considerable drop of 2.4 percent in the unemployment rate. These two examples highlight the peculiarities of the seasonal effects on the labor force in Northeast Minnesota (see Figure 2 and Table 1).
| Northeast Minnesota Change in Available Labor Force from Winter to Summer | |||||||
|---|---|---|---|---|---|---|---|
| Year | Labor Force Estimates | Labor Force Change | |||||
| Season | Labor Force Estimate | Unemployed
Estimate |
Change from
Q1 to Q3 |
Labor Force | Unemployed
Workers |
Unemployment
Rate |
|
| 2008 | Winter | 164,758 | 11,486 | Absolute Change | +5,596 | -720 | -0.6% |
| Summer | 170,354 | 10,766 | Percent Change | +3.4% | -6.3% | ||
| 2010 | Winter | 169,626 | 16,910 | Absolute Change | +4,036 | -3,572 | -2.3% |
| Summer | 173,662 | 13,338 | Percent Change | +2.4% | -21.1% | ||
| 2012 | Winter | 167,108 | 13,162 | Absolute Change | +3,140 | -2,327 | -1.5% |
| Summer | 170,248 | 10,836 | Percent Change | +1.9% | -17.7% | ||
| 2014 | Winter | 168,545 | 12,379 | Absolute Change | -345 | -4,058 | -2.4% |
| Summer | 168,201 | 8,321 | Percent Change | -0.2% | -32.8% | ||
| Source: DEED Local Area Unemployment Statistics (LAUS) | |||||||
Industries are also affected by the changing of the seasons and this effect can be varied depending on the nature of the industry's activity. One way to identify the industries that experience seasonal variation is to analyze hiring behavior because industries that have greater demand in the summer will need to hire new employees to keep up with the increased workload. DEED's Quarterly Workforce Indicators (QWI) program keeps track of hiring data by industry for Northeast Minnesota. Because the data is quarterly, it is consistent with the employment data used in this article to determine seasonal variation (see Table 2).
| Industries with the Highest Amount of Seasonal Variation of All Hires for Northeast Minnesota, 2004-2013 | ||||
|---|---|---|---|---|
| 2004-2013 Average | ||||
| Quarter 1 Estimate | Quarter 3 Estimate | Absolute Change | Percent Change | |
| Total, All Industries | 20,060 | 26,361 | 6,300 | 31.4% |
| Construction | 1,443 | 2,539 | 1,097 | 81.0% |
| Retail Trade | 2,148 | 3,375 | 1,227 | 62.2% |
| Arts, Entertainment, and Recreation | 694 | 1,314 | 620 | 103.6% |
| Accommodation and Food Services | 2,663 | 4,916 | 2,253 | 91.7% |
| Source: DEED, QWI Explorer Application | ||||
Table 2 lists the industries and the seasonal variation that occurs to the number of hires. It's not surprising that the Construction industry experiences considerable hiring activity during the summer, as it is nearly impossible to dig foundations in frozen ground or repairs roads which are snow covered and, while Retail Trade stores hire consistently year-round, the hiring activity climbs in the summer.
The industry that experiences the most hiring and the biggest seasonal shift in Northeast Minnesota is the Accommodation and Food Services industry, however, as it has averaged 2,663 hires during the winter and 4,916 in the summer. The region's hotels and restaurants nearly double their hiring in the summer compared to winter, a pattern that is also shared by the Arts, Entertainment, and Recreation industry. All of these industries respond to the influx of summer tourists and seasonal residents, who create more demand for eating, drinking, shopping, and other recreation activities.
Hiring activity is one indicator of the effects that seasons have on industries, but it doesn't differentiate whether all those hires generate actual growth of new jobs or might instead be indicative of high turnover within the industry. Using DEED's Quarterly Census of Employment and Wages (QCEW) data, however, the industries that had considerable hiring activity can be analyzed to determine the extent of job growth between winter and summer.
For the Total of All Industries in Northeast Minnesota, the average net change in employment from the first quarter to the third quarter was an increase of 5,705 jobs or a 4.2 percent gain. Nearly half of all employment growth in the region that occurs from winter to summer can be attributed to the Accommodation and Food Services Industry where, on average, just over 2,800 jobs are gained through the changing of the seasons each year (see Table 3). Hiring activity and job growth for Northeast Minnesota is affected by the changing of the seasons and the Accommodation and Food Services Industry is a major reason why.
| Seasonal Variation in Industry Employment for Northeast Minnesota, 2008-2013 | ||||
|---|---|---|---|---|
| 2008-2013 Average | ||||
| Quarter 1 Estimate | Quarter 3 Estimate | Absolute Change | Percent Change | |
| Total, All Industries | 135,190 | 140,895 | 5,705 | 4.2% |
| Construction | 4,821 | 6,806 | 1,985 | 41.2% |
| Retail Trade | 16,955 | 17,770 | 815 | 4.8% |
| Arts, Entertainment, and Recreation | 3,444 | 4,073 | 630 | 18.3% |
| Accommodation and Food Services | 12,970 | 15,788 | 2,818 | 21.7% |
| Source: DEED Quarterly Census of Employment and Wages (QCEW) | ||||
As winter recedes and summer approaches, the economic activity for Northeast Minnesota springs into action. The labor force expands as the construction season resumes, and the unemployment rate falls as shops, restaurants, and resorts look to hire in preparation for their recurring visitors. The changing of the seasons has a considerable impact on the regional economy and, much like the seasons themselves, is a uniquely defining characteristic of Northeast Minnesota.