by Erik White
July 2015
Even as the state and nation have enjoyed a strong rebound from the Great Recession, one important element of the recovery that has been missing is strong earnings and wage growth. The recovery from the recession is also underway in Northeast Minnesota. Unemployment rates have dropped around the region, many sectors of the economy have returned to pre-recession levels of employment, and job vacancies are near all-time highs.
In contrast to the state and nation, data from DEED's Current Employment Statistics (CES) program show that average hourly earnings have increased at a faster rate in Northeast Minnesota's Metropolitan Statistical Area (MSA). Employers in the Duluth-Superior MSA - which consists of St. Louis and Carlton Counties in Minnesota and Douglas County in Wisconsin - reported an increase of $3.55 to its average earnings per hour for all private employees since 2009. This moved the region's average hourly earnings closer to the state average, which grew just $2.38 since the recession (see Table 1).
| Table 1: Average Hourly Earnings for all Private Sector Employees, Minnesota | |||
|---|---|---|---|
| Area | 2014 | 2009 | 2009-2014 Change |
| Duluth-Superior MSA | $24.57 | $21.02 | $3.55 |
| Mankato MSA | $22.25 | $22.49 | -$0.24 |
| Minneapolis-St Paul MSA | $26.60 | $25.91 | $0.69 |
| Rochester MSA | $33.74 | $25.02 | $8.72 |
| St. Cloud MSA | $22.81 | $21.09 | $1.72 |
| State of Minnesota | $25.79 | $23.41 | $2.38 |
| United States | $24.47 | $22.19 | $2.28 |
| Source: DEED Current Employment Statistics (CES) program | |||
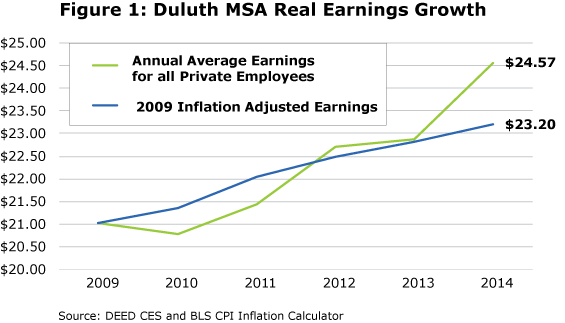
Since the estimates presented in Table 1 are not adjusted for inflation, however, the difference is a reflection of nominal wage growth and not real wage growth. Figure 1 takes into account the role inflation has on earnings over a period of time, demonstrating the real growth experienced in the region.

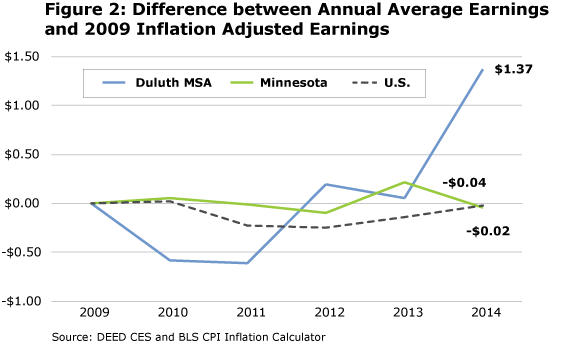
If earnings grew at the same rate as inflation from 2009 based on the Bureau of Labor Statistics Inflation Calculator, they would be $23.20 an hour in 2014. However, annual average earnings for all private employees in the Duluth-Superior MSA were actually $24.57, a $1.37 difference from the 2009 inflation-adjusted estimate. This growth in real earnings is a recent phenomenon, thanks to a $1.69 gain in annual average earnings from 2013 to 2014. Prior to this jump, earnings were near or below the 2009 inflation adjusted earnings trend line.
For the Duluth MSA this current real earnings growth runs counter to the prevailing state and national income stagnation. Figure 2 shows the differences between actual average earnings and inflation-adjusted earnings for the state and the nation, which shows that earnings in both the U.S. and Minnesota have closely followed inflation and currently reside slightly below.

A different approach to measure earnings growth is to utilize DEED's Occupational Employment Statistics (OES) program, which produces detailed wage estimates for more than 800 occupations by surveying about 21,000 businesses in Minnesota. It should be noted that one of the main differences between the survey programs is that OES measures occupation-specific wages, whereas CES measures industry earnings.
According to OES data, many jobs in the region have increased their wages over time, but at very different rates. The occupational groups that have seen considerable growth to their mean wages tend to be those that have higher wages to start with.
Business and financial, architecture and engineering, legal, and computer and mathematical occupations have seen the biggest growth, with non-inflation adjusted increases of more than $4.00 from 2009 to 2014. Production and construction occupations have also added to their mean wage during the recovery from the recession. Jobs with lower wages - such as food preparation, sales, building and grounds cleaning and maintenance, and personal care occupations - tended to show smaller amounts of growth or declines (see Table 2).
| Table 2: Mean Wages by Occupation Group, Duluth Metropolitan Statistical Area 2009-2014 | ||||
|---|---|---|---|---|
| SOC Code | Occupation Title | 2014 Mean Wage | 2009 Mean Wage | Difference of 2009 and 2014 Mean Wage |
| 13-0000 | Business and financial operations occupations | $28.30 | $23.31 | +$4.99 |
| 17-0000 | Architecture and engineering occupations | $33.08 | $28.65 | +$4.43 |
| 23-0000 | Lawyers, judges, and related workers | $39.26 | $34.99 | +$4.27 |
| 15-0000 | Computer and mathematical occupations | $32.02 | $28.00 | +$4.02 |
| 11-0000 | Management occupations | $42.05 | $38.49 | +$3.56 |
| 33-0000 | Protective service occupations | $21.14 | $18.70 | +$2.44 |
| 47-0000 | Construction and extraction occupations | $25.59 | $23.76 | +$1.83 |
| 51-0000 | Production occupations | $19.34 | $17.55 | +$1.79 |
| 45-0000 | Farming, fishing, and forestry occupations | $16.83 | $15.21 | +$1.62 |
| 49-0000 | Installation, maintenance, and repair occupations | $22.58 | $21.01 | +$1.57 |
| 31-0000 | Healthcare support occupations | $13.48 | $12.07 | +$1.41 |
| 25-0000 | Education, training, and library occupations | $23.13 | $21.87 | +$1.26 |
| 21-0000 | Community and social services occupations | $19.06 | $17.90 | +$1.16 |
| 53-0000 | Transportation and material moving occupations | $17.00 | $15.86 | +$1.14 |
| 43-0000 | Office and administrative support occupations | $15.88 | $14.82 | +$1.06 |
| 19-0000 | Life, physical, and social science occupations | $28.27 | $27.31 | +$0.96 |
| 35-0000 | Food preparation and serving related occupations | $9.59 | $9.37 | +$0.22 |
| 27-0000 | Arts, design, entertainment, sports, and media occupations | $18.77 | $18.65 | +$0.12 |
| 29-0000 | Healthcare practitioners and technical occupations | $33.48 | $33.46 | +$0.02 |
| 39-0000 | Personal care and service occupations | $10.86 | $10.86 | $0.00 |
| 41-0000 | Sales and related occupations | $13.61 | $13.64 | -$0.03 |
| 37-0000 | Building and grounds cleaning and maintenance occupations | $11.66 | $11.74 | -$0.08 |
| Source: DEED's Occupational Employment Statistics Program (OES) | ||||
Table 2 shows that different occupation groups saw different amounts of wage growth, but the same trends also occurred within each occupational group. Higher-paid and higher-skilled jobs tended to see larger wage increases than lower-paid and lower-skilled jobs.
The health care field provides a perfect example. Already one of the highest-paying jobs, Dentists have seen wages jump by an incredible $22.63 since 2009, while Dental Assistants and Dental Hygienists saw their wages decrease or stay relatively the same. A similar relationship exists for Pharmacists, who have seen wage increases of nearly $5.00 an hour, compared to Pharmacy Technicians and Pharmacy Aides, where wages increased less than a dollar (see Table 3).
| Table 3: Mean Wages for Selected Occupations, Duluth MSA, 2009-2014 | ||||
|---|---|---|---|---|
| SOC Code | Title | 2009 Mean Wage | 2014 Mean Wage | Difference of 2009 and 2014 Mean Wage |
| 29-1021 | Dentists, general | $68.36 | $90.99 | $22.63 |
| 29-1071 | Physician assistants | $42.61 | $50.92 | $8.31 |
| 29-1051 | Pharmacists | $54.37 | $59.34 | $4.97 |
| 29-1123 | Physical therapists | $33.67 | $36.46 | $2.79 |
| 29-2052 | Pharmacy technicians | $14.38 | $15.32 | $0.94 |
| 31-1011 | Home health aides | $10.39 | $11.08 | $0.69 |
| 29-2021 | Dental hygienists | $29.47 | $29.92 | $0.45 |
| 31-9095 | Pharmacy aides | $11.86 | $12.25 | $0.39 |
| 31-9091 | Dental assistants | $18.39 | $17.55 | -$0.84 |
| 29-1011 | Chiropractors | $33.40 | $27.96 | -$5.44 |
| Source: DEED OES Program | ||||
Another factor that influenced the magnitude of earnings growth in Northeast Minnesota was the type of jobs that have been recovered. As high-paying jobs are being regained in the economy, earnings grow more quickly for the region, and low-paying jobs have less of an impact.
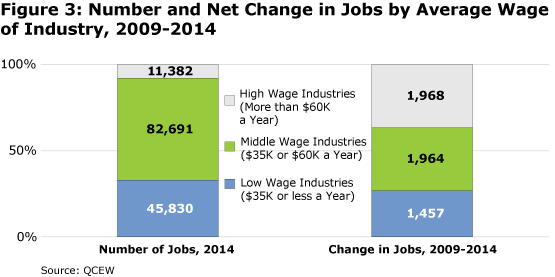
DEED's Quarterly Census of Employment and Wages (QCEW) program provides industry employment and payroll statistics. QCEW data for the Arrowhead region - which includes Aitkin, Carlton, Cook, Itasca, Koochiching, Lake, and St. Louis counties - provides more insight into the region's wage growth. Industries that had annual average wages of more than $60,000 a year gained 1,968 jobs in Northeast Minnesota since 2009, nearly identical to the number of jobs added in industries that had wages between $35,000 and $60,000. Industries with annual average wages below $35,000 added the smallest number of new jobs, gaining just 1,457 jobs from 2009 to 2014.
Because there are many fewer jobs in the high-wage industries, their recent rise is even more remarkable. Employment in industries paying more than $60,000 grew more than 20 percent during the time of recovery, while growth in all other industries paying less than $60,000 was below 3.5 percent (see Table 4 and Figure 3).
| Table 4: Net Job Change by Average Wage of Industry, Northeast Minnesota 2009-2014 | ||||
|---|---|---|---|---|
| Industry Class | Number of Jobs, 2014 | Number of Jobs, 2009 | Net Change of Jobs, 2009-2014 | Percent Change of Jobs, 2009-2014 |
| More than $60K a year | 11,382 | 9,414 | +1,968 | +20.9% |
| $35K to $60K a year | 82,691 | 80,727 | +1,964 | +2.4% |
| Less than $35K a year | 45,830 | 44,373 | +1,457 | +3.3% |
| Source: DEED's Quarterly Census of Employment and Wages (QCEW) program | ||||

Table 5 breaks down the particular industries that have gained the greatest number of jobs since 2009 in Northeast Minnesota. In sum, the region has seen an increase of 4,810 jobs for all industries. The Mining industry saw the greatest increase during this time frame, adding more than 1,510 jobs or about 30% of all employment gains in the region. Mining wages are also some of the highest in the region with an average weekly wage of $1,731.
The Health Care and Social Assistance and Construction sectors also grew, both creating more than 700 jobs during the past five years. Other industries that experienced considerable growth included Other Services, Professional, Scientific, and Technical Services, Retail Trade, Administrative Support and Waste Management Services, and Accommodation and Food Services.
The wages paid by several of these industries were typically higher than the average for all industries, leading to the wage growth. For example, Construction and Professional, Scientific, and Technical Services had average weekly wages over $1,000 and Health Care had weekly wages of $840. The lower paying industries like Retail Trade and Accommodation and Food Services also gained back jobs, but not at the same magnitude as those industries with higher wages (see Table 5).
| Table 5: Northeast Minnesota Employment Statistics, Annual 2014-2009 | ||||
|---|---|---|---|---|
| Industry Title | Number of Jobs, Annual 2014 | Number of Jobs, Annual 2009 | Net Change of Jobs, 2009-2014 | 2014 Average Weekly Wage |
| Total, All Industries | 141,554 | 136,744 | +4,810 | $779 |
| Mining | 4,590 | 3,048 | +1,542 | $1,731 |
| Health Care and Social Assistance | 32,805 | 32,008 | +797 | $840 |
| Construction | 6,674 | 5,932 | +742 | $1,046 |
| Other Services | 4,770 | 4,331 | +439 | $477 |
| Professional, Scientific, and Technical Services | 4,177 | 3,786 | +391 | $1,160 |
| Retail Trade | 17,632 | 17,265 | +367 | $449 |
| Administrative Support and Waste Mgmt. Services | 4,105 | 3,788 | +317 | $484 |
| Accommodation and Food Services | 14,411 | 14,180 | +231 | $267 |
| Source: DEED QCEW | ||||
The Northeast region of Minnesota has experienced real earnings growth since the recession, a phenomenon that adds momentum to the recovery dialogue. This wage growth can be seen in many different ways. Higher-paying occupations - such as business, engineering, and management - have seen higher wage gains, while lower paying jobs including personal care, sales, and building maintenance have yet to experience the same type of gains.
Northeast Minnesota has also experienced larger gains in wages over the past five years because the region has added jobs faster in higher-paying industries such as mining, health care, construction, and professional, scientific, and technical services. This has produced real earnings growth, a distinguishing attribute for the region.