by Carson Gorecki
June 2020
The coronavirus pandemic that spread across the nation and state in March and April of 2020 put a halt to the longest running economic expansion in recent history. Statewide, more than 660,000 workers had filed applications for Unemployment Insurance (UI) in Minnesota from March 16 to May 16, with specific demographics, geographies and industries more affected than others. To put the recent economic events into context, DEED has provided a set of articles explaining the impact in each region.
Due to the region's unique industry mix and high concentration of employment in hard-hit industries like leisure and hospitality, retail trade, and health care and social assistance, Northeast Minnesota showed the largest impact from Unemployment Insurance (UI) claims of the six planning regions in the state. Through May 16, UI applications were filed by 24.1% of the total labor force in Northeast Minnesota, compared to 21.6% of the state's labor force. In addition, the region's most impacted jobs during the current crisis tend to be held by workers that are younger, less educated, more diverse, and female.
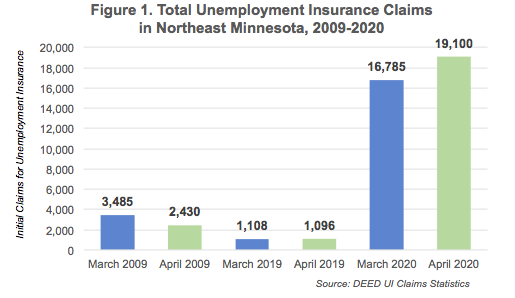
In the two months between March 16 and May 17, workers filed 39,095 applications for UI in the seven-county Northeast Minnesota planning region. This number of claims was unprecedented, just as it was for the rest of the country. To put this surge in perspective, during the peak of the Great Recession in 2009, just over 5,900 people filed claims in March and April. In March and April of 2019, there were a total of just 2,204 initial claims for unemployment. With nearly 36,000 claims, 2020 has shown a 600% increase compared to 2009, and more than a 1,600% increase over the prior year (see Figure 1).

Although all parts of the region saw unprecedented numbers of unemployment, the impacts were not spread across communities equally. The city of Duluth and Cook and Lake Counties have suffered much higher than average shares of UI claims. Cook, at 36.1% of its March labor force, had the largest share of UI applications of all 87 counties in Minnesota. Lake County had the fourth-highest share of unemployment claims in the state with 28.5% of its labor force filing claims (see Table 1).
Table 1. Unemployment Insurance Applications and Labor Force, Northeast Minnesota, March 16 - May 16, 2020
| Area | Cumulative Number of UI Applications (Mar 16 - May 16) | UI Applications as Percent of March 2020 Labor Force | Percent of Regional UI Applications (Mar 16 - May 16) |
|---|---|---|---|
| Minnesota | 661,965 | 21.6% | n/a |
| Northeast | 39,095 | 24.1% | 100.0% |
| Aitkin | 1,544 | 21.6% | 3.9% |
| Carlton | 3,968 | 22.3% | 10.1% |
| Cook | 1,030 | 36.1% | 2.6% |
| Itasca | 5,205 | 23.6% | 13.3% |
| Koochiching | 1,110 | 19.4% | 2.8% |
| Lake | 1,512 | 28.5% | 3.9% |
| St. Louis | 24,726 | 24.3% | 63.2% |
| City of Duluth | 16,532 | 34.8% | 42.4% |
| Source: DEED UI Statistics, Local Area Unemployment Statistics | |||
St. Louis, Itasca, Carlton, and Aitkin Counties also had average or above average shares of unemployment applications. Only Koochiching, with 19.4% of its labor force filing claims, was below the state average. With the region's customer-facing economy far from equilibrium, employers in the region have struggled to keep payrolls intact.
While white people made up 93.7% of the labor force in the region, they accounted for just 86.9% of UI applications through May 16. This means that layoff activity has been more concentrated among People of Color within the region, and for three groups in particular. Over 40% of Black or African American workers have applied for unemployment, nearly double the rate for white workers. Similarly, more than one-third of American Indian and Asian or Pacific Islander workers in the region filed UI applications through May 16. Likewise, 29% of workers of Hispanic or Latino origin were affected (see Table 2). The adverse employment impacts during the current crisis on People of Color could deepen the economic disparities already present in the region.
Table 2. Northeast Minnesota Unemployment Insurance Applicants by Race, Mar. 16-May 16
| Race | Cumulative UI Applications Through May 16 | Share of UI Applications | Total Labor Force | Share of Total Labor Force | UI Applications as a Share of Total Labor Force |
|---|---|---|---|---|---|
| White Alone | 33,871 | 86.9% | 152,356 | 93.7% | 22.2% |
| Black or African American | 635 | 1.6% | 1,533 | 0.9% | 41.4% |
| American Indian/Alaska Native | 1,394 | 3.6% | 3,746 | 2.3% | 37.2% |
| Asian or Pacific Islanders | 475 | 1.2% | 1,403 | 0.9% | 33.9% |
| Some Other Race and Two or More Races | 803 | 2.1% | 3,646 | 2.2% | 22.0% |
| Choose not to answer | 1,174 | 3.0% | N/A | N/A | N/A |
| Hispanic or Latino | 623 | 1.6% | 2,150 | 1.3% | 29.0% |
| Total | 38,977 | 100.0% | 162,684 | 100.0% | 24.0% |
| Source: DEED Unemployment Insurance Statistics, 2014-2018 American Community Survey 5-Year Estimates | |||||
The COVID-19 employment impacts are not only unique due to their overwhelming scale and geographic variability, they are also most deeply impacting a different gender and age demographic than in recent years or even during the Great Recession.
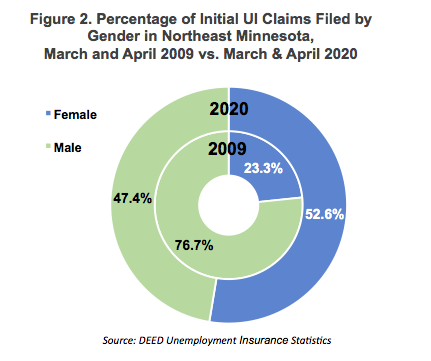
In 2009 and 2019, about three-quarters of UI claims in the region were filed by males whereas in March and April 2020, more than half were filed by females (see Figure 2). This is because a very different set of occupations were impacted this time in comparison to past years. Construction and production occupations, which are predominantly held by males, accounted for just under half of UI claims activity in Northeast Minnesota in March and April of 2009, but just under 14% of claims in 2020. Instead, nearly a fifth of claims in March and April 2020 were filed by food preparation and serving workers, which was 4.5 times more than in 2009 and another 16.4% of claims were filed by sales and office workers, which was double the percent of claims during March and April 2009. Many of these jobs are held by women.
The age profile of claimants is younger for 2020 than for previous years. In March and April 2020, 30.8% of claims were filed by people under age 30; in spring 2019, just 20.6% of claims were filed by people under 30.

The Arrowhead region has the largest share of food preparation and serving related occupations, the second largest share of health care occupations, and the third largest share of sales occupations among all six planning regions in the state1. Not surprisingly, Northeast Minnesota exhibited the highest share of claims across the six regions in large part because of the high concentration of job losses in the hospitality, sales and health care fields.
The health care industry, while serving a vital role in the fight against the pandemic, has nonetheless experienced high numbers of layoffs, especially at clinics and dental offices that were no longer able to see patients. Likewise, many leisure and hospitality jobs depend upon interpersonal interaction that also increases the risk of spreading the virus. For this reason, and because many service jobs were deemed non-critical, leisure and hospitality workers have borne a significant part of coronavirus impacts.
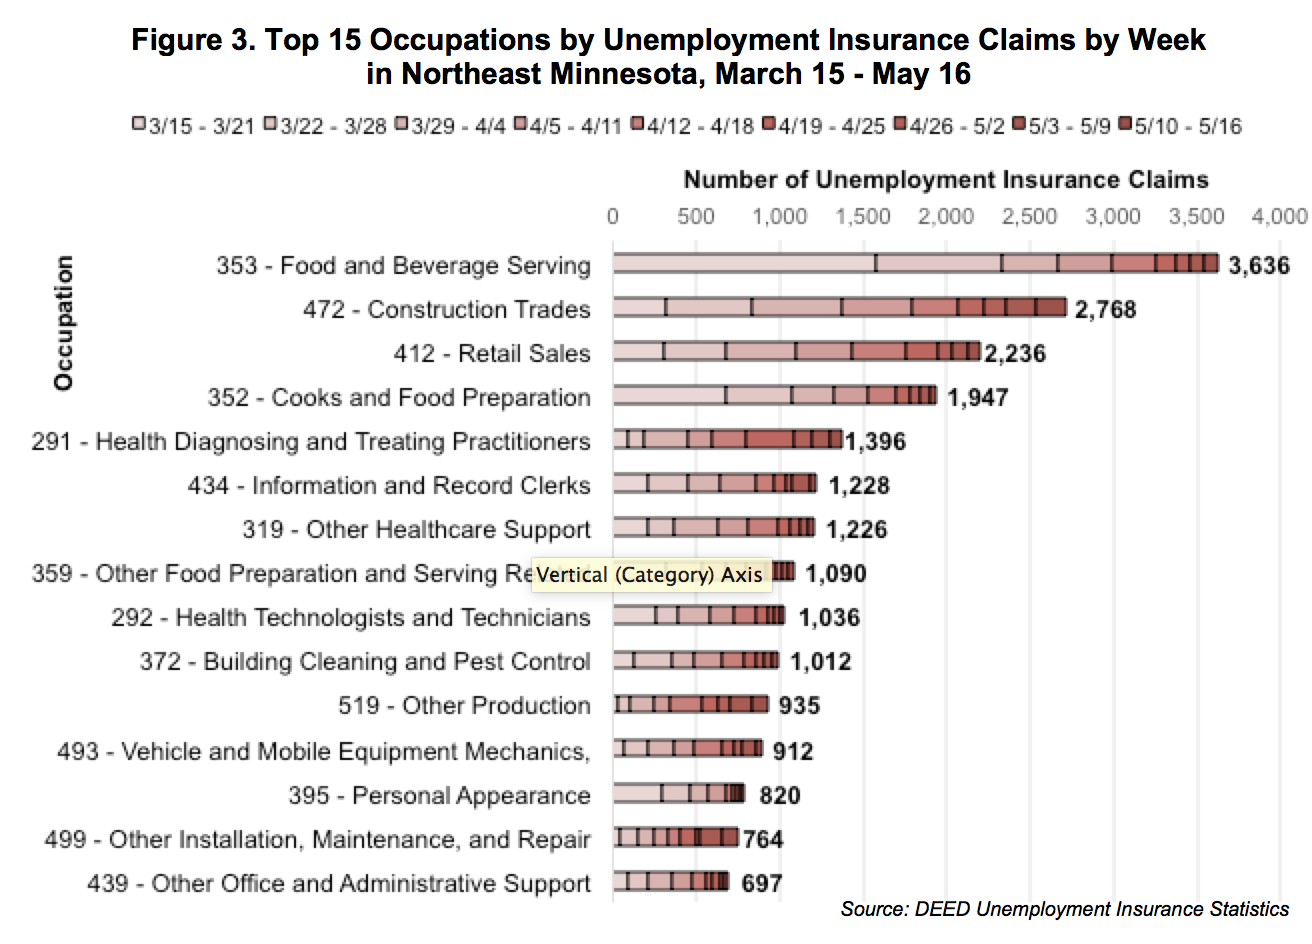
Food preparation and serving related occupations drove the initial rush of claims in the region, and across the state. Food and beverage serving occupations alone accounted for more than a quarter of all claims in the first week of the coronavirus-related shutdown. The occupations with the next highest numbers of claims, construction trades and retail sales workers, each took more than four weeks to match food and beverage serving's first week total (see Figure 3). Other food and serving related and personal care occupations also experienced large numbers of claims initially followed by week over week declines.

Following massive numbers in the last two weeks of March, initial UI claims have declined week over week for most occupations. However, a few occupations such as information and record clerks, construction trades, and extraction workers have seen recent increases, both in the number and share of claims. Likewise, other production, other installation, maintenance and repair, and nursing, psychiatric and home health aides have all seen their relative share of claims increase, indicating the delayed onset and/or prolonged effects of the pandemic on their specific categories of work.
The industries with the greatest number of UI claims in 2020 are different than those during the Great Recession. In March and April 2009, manufacturing, construction, and mining combined for 53% of all claims. In March and April 2020, these three industries accounted for just 16.4%2 of claims. The top three industries in shares of claims in spring 2020 were accommodation and food services, health care and social assistance, and retail trade, combining for just under half of all claims. The difference in proportion of claims by industry underlines yet again how the top two employing sectors in the region – leisure and hospitality and health care and social assistance – have been uniquely vulnerable to the coronavirus and its subsequent economic ripple effects.
Data from DEED's Quarterly Employment Demographics and the U.S. Census Bureau's Quarterly Workforce Indicators drives home the point that the most impacted jobs during the current crisis tend to be held by workers that are younger, less educated, more diverse, and female. More than three quarters of the health care workforce is female. The retail industry has an above average number of younger and less educated workers. The leisure and hospitality workforce is more likely to be female, younger, more racially diverse, and less educated than the regional average (see table 3). Leisure and hospitality and retail workers also make relatively low average wages, further compounding their potential exposure to the negative effects of prolonged layoffs.
Table 3. Worker Characteristics of Selected Industries in Northeast Minnesota, 2019
| Industry Title | Percent Female Workers | Percent High School Diploma or Less | Percent Workers of Color | Percent 24 Years and Under | Average Weekly Wage |
|---|---|---|---|---|---|
| All Industries | 50.5% | 39.8% | 9.3% | 18.1% | $897 |
| Health care and Social Assistance | 78.3% | 35.3% | 8.2% | 14.8% | $994 |
| Leisure and Hospitality | 55.9% | 48.7% | 15.6% | 38.8% | $357 |
| Retail Trade | 47.8% | 46.7% | 7.9% | 28.7% | $524 |
| Source: DEED Quarterly Census of Employment and Wages, Quarterly Workforce Indicators, DEED Quarterly Employment Demographics | |||||
The effects of the coronavirus pandemic are indeed global. Yet, it is at the local and individual level that the true impacts can be seen with devastating clarity. The labor market of Northeast Minnesota, one with a high concentration of health care and hospitality jobs, has shown itself to be more susceptible to these impacts than other areas. How these vital industries and their workers recover will determine in large part the recovery of the region.
1Includes both health care practitioners and technical occupations and health care support occupations.
2Recent large layoffs by large mining companies indicate that the share of Unemployment Insurance applications filed by workers in the mining industry will greatly increase. The translation from occupational group to industry tends to underestimate mining industry figures.