By Rachel Vilsack
June 2014
More than half of the state’s 87 counties still haven’t recovered all the private-sector jobs that were lost in the recession.
Minnesota has recovered all the private-sector jobs that were lost in the recession, but the recovery has not occurred uniformly across the state. While some counties never lost jobs during the recession, others still haven’t regained all the jobs that disappeared during that period.
This story examines data from the Quarterly Census of Employment and Wages to determine which counties have fared the best since the recession and which ones are still in recovery mode.
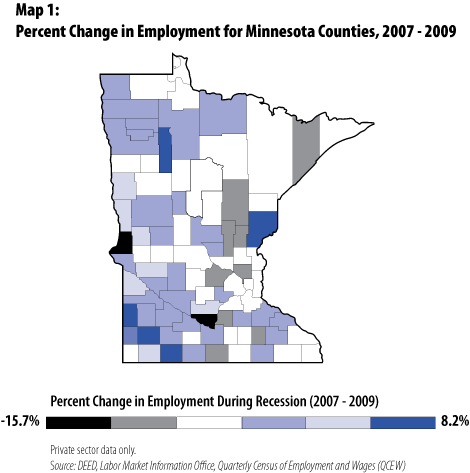
Map 1 displays the percentage change in private-sector employment for Minnesota’s 87 counties. A dozen counties had no job losses during the recession between 2007 and 2009. Clearwater County led the state in employment growth during that period at 8.2 percent, gaining 136 jobs. Employment gains also occurred in Jackson (up 5.8 percent), Murray (up 4.7 percent), Lincoln (up 4.6 percent), Pine (up 4.2 percent), Clay (up 3.7 percent), Nobles (up 3.5 percent), Swift (up 2.9 percent), Sibley (up 1.5 percent), Lac qui Parle (up 1.3 percent), Grant (up 1.2 percent) and Wilkin (up 1.2 percent).

Counties with the largest employment had the most numeric job losses during the recession. Hennepin County lost 44,691 private-sector jobs between 2007 and 2009, followed by Ramsey (down 14,343), Anoka (down 8,582) and Dakota (down 7,288). These four counties rank first, second, fourth and third, respectively, for private-sector jobs in Minnesota.
Traverse County, with the third-smallest private employment base in the state, had the highest percentage job loss (down 15.7 percent) between 2007 and 2009. Nicollet (down 13.7 percent), Faribault (down 10.8 percent), Dodge (down 10.8 percent) and Le Sueur (down 10.4 percent) also had double-digit employment declines during the recession.
Of the 75 Minnesota counties that experienced job losses during the recession, only 20 fully recovered and can claim higher average annual employment in 2012 than in 2007 (see Table 1). The five counties with the largest percentage gains in jobs were Pennington (up 10.9 percent), Marshall (up 7.9 percent), Stevens (up 6.6 percent), Cook (up 5.5 percent) and Kittson (up 4.2 percent).
With just 62 more jobs in 2012 than in 2007, Olmsted County’s place on this list is worth noting. Olmsted ranks fifth among Minnesota counties in private-sector employment. During the recession, 2,447 jobs were lost by businesses in the county, representing 2.9 percent of private jobs. Job declines continued in 2010 with an additional 1,322 jobs lost. By 2012, the county had recouped 3,831 jobs from its 2010 low and exceeded pre-recessionary employment levels by 62 jobs.
| Minnesota Counties with Recession Job Losses that Rebounded by 2012 | |||||
|---|---|---|---|---|---|
| - | 2007 Employment | 2009 Employment | 2012 Employment | Numeric Employment Change, 2007-2012 | Percent Change in Employment, 2007-2012 |
| Pennington County | 7,330 | 7,267 | 8,132 | 802 | 10.9% |
| Marshall County | 1,574 | 1,544 | 1,699 | 125 | 7.9% |
| Stevens County | 3,886 | 3,690 | 4,143 | 257 | 6.6% |
| Cook County | 1,725 | 1,626 | 1,820 | 95 | 5.5% |
| Kittson County | 1,089 | 1,056 | 1,135 | 46 | 4.2% |
| Steele County | 19,002 | 17,964 | 19,704 | 702 | 3.7% |
| Rock County | 2,400 | 2,252 | 2,483 | 83 | 3.5% |
| Lake County | 3,438 | 3,127 | 3,554 | 116 | 3.4% |
| Mahnomen County | 616 | 587 | 636 | 20 | 3.2% |
| Carver County | 28,650 | 27,524 | 29,364 | 714 | 2.5% |
| Becker County | 10,480 | 9,895 | 10,690 | 210 | 2.0% |
| Blue Earth County | 32,230 | 31,256 | 32,793 | 563 | 1.7% |
| Goodhue County | 17,090 | 16,694 | 17,234 | 144 | 0.8% |
| Traverse County | 810 | 683 | 816 | 6 | 0.7% |
| Itasca County | 12,487 | 11,902 | 12,540 | 53 | 0.4% |
| Olmsted County | 83,210 | 80,763 | 83,272 | 62 | 0.1% |
| Pope County | 3,145 | 2,966 | 3,146 | 1 | 0.0% |
| Wabasha County | 5,781 | 5,567 | 5,782 | 1 | 0.0% |
| Kandiyohi County | 18,693 | 18,281 | 18,696 | 3 | 0.0% |
| Beltrami County | 13,197 | 12,725 | 13,198 | 1 | 0.0% |
| Data are private sector only.Source: DEED, Quarterly Census of Employment and Wages (QCEW). | |||||
With just over 8,100 jobs in 2012, Pennington County saw the state's fastest employment growth rate between 2007 and 2012 and the biggest gain in jobs. These gains were largely concentrated in the trade, transportation and utilities sector, which accounts for half of private-sector employment in the county. Job losses occurred in the county's other large industrial sectors — manufacturing and education and health services — between 2007 and 2012.
Like Pennington County, Marshall County is located in northwestern Minnesota along the North Dakota border. With 125 more private-sector jobs in 2012 than 2007, the county captured the second-highest percent change in employment. Trade, transportation and utilities is the largest private-sector industry in the county, but small job gains were seen in nearly all major industry sectors between 2007 and 2012.
Stevens County in western Minnesota is home to the city of Morris. The county's major employing industrial sectors in 2012 included manufacturing; education and health services; and trade, transportation and utilities. The largest private employment growth between 2007 and 2012, however, was in the natural resources (including agriculture) and mining sector, which is likely driven by its dairy and hog operations. According to the U.S. Department of Agriculture, Stevens County had 560 farms in 2012.1
Cook County is the northeastern-most county in Minnesota, located along the North Shore and home to part of the Superior National Forest and the Boundary Waters Canoe Area Wilderness. More than half of the county's private jobs are in the leisure and hospitality sector. That industry shed jobs during the recession but had recovered to within eight jobs of its 2007 employment level by 2012. The trade, transportation and utilities sector saw the largest job gains during those five years, helping to push the county's overall employment level up by 5.5 percent.
For contrast, Kittson County is the northwestern-most county in Minnesota, located along the Canadian border of Manitoba and the North Dakota border. With 1,135 jobs in 2012, Kittson had the fifth-largest percentage growth in private-sector jobs between 2007 and 2012, gaining 46 jobs. Industry employment is concentrated in education and health services and in trade, transportation and utilities. Both sectors saw job gains between 2007 and 2012.
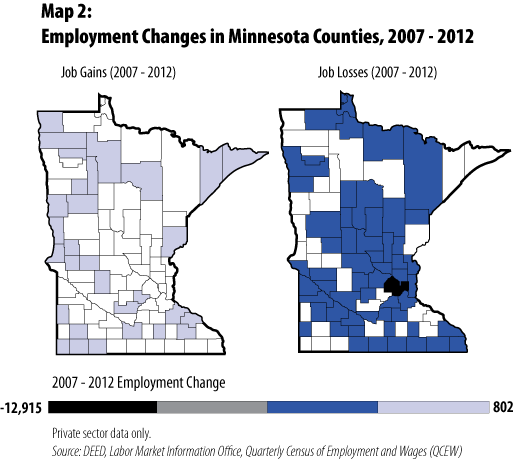
Map 2 presents a side-by-side illustration of which counties gained jobs and which did not over the 2007 to 2012 period. Ramsey and Hennepin stand out as having the largest number of jobs to regain before reaching their pre-recessionary private sector employment levels. They still need to regain 12,915 and 9,923 jobs, respectively, to get back to pre-recessionary levels.

In 2012, Anoka (down 4,244), St. Louis (down 2,549), Dakota (down 2,393), Crow Wing (down 2,051), Stearns (down 1,635), Nicollet (down 1,472), McLeod (down 1,031), Washington (down 1,018), and Scott (down 1,017) are still 1,000 or more private-sector jobs below their 2007 employment levels.
Aitkin County is still 15.9 percent below its 2007 employment level, followed by Nicollet at 12.2 percent.
Swift and Lac qui Parle counties are included in Map 2 as losing jobs between 2007 and 2012. While these counties had job gains between 2007 and 2010, employment in the years since declined to pre-2007 levels.
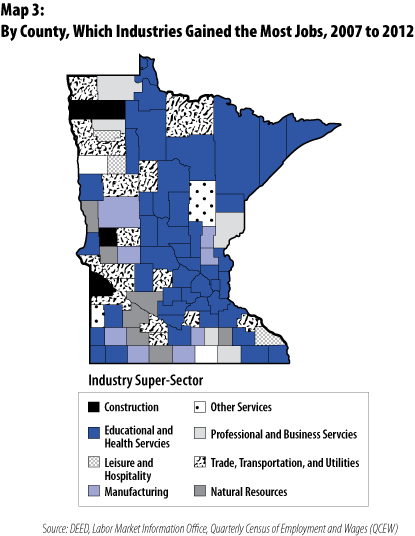
A county-level analysis of private employment in 10 industry super-sectors shows that many counties have one or more sectors that have equaled or surpassed their 2007 employment levels. Map 3 highlights the industrial sectors with the highest numeric job gains between 2007 and 2012, while Map 4 shows the sectors with the largest numeric job losses.2 In 2012, all industrial sectors in Freeborn and Norman counties had private employment levels at or below their 2007 levels.

The most private-sector jobs were recovered in education and health services in 42 counties, and that same sector is above 2007 employment levels in 63 counties (see Table 2).
Surprisingly, natural resources and mining was the second-most recovered sector in Minnesota, with 51 counties regaining their pre-recessionary job levels by 2012. And while manufacturing remains the least-recovered sector in 32 counties, the industry has recovered in 22 counties overall. Manufacturing was also the most-recovered industry in eight counties: Isanti, Kanabec, Faribault, Pope, Murray, Jackson, Otter Tail and Waseca.
| Industry Employment by County, 2007 to 2012 | |
|---|---|
| Industry | Number of Counties Where 2012 Employment Exceeds 2007 Employment |
| Education and Health Services | 63 |
| Natural Resources and Mining | 51 |
| Trade, Transportation and Utilities | 37 |
| Professional and Business Services | 34 |
| Other Services | 32 |
| Leisure and Hospitality | 28 |
| Manufacturing | 22 |
| Financial Activities | 21 |
| Construction | 17 |
| Information | 9 |
| Data are private sector only. Source: DEED, Quarterly Census of Employment and Wages (QCEW). | |
Recovery is still underway in more than half of Minnesota's counties, with 2012 employment levels lagging their 2007 pre-recessionary benchmarks. When 2013 annual average employment data for counties become available at midyear, we can expect to see more counties cross over their 2007 employment levels, and, on net, finally recover from the recession.
Some recessionary employment losses will be permanent, as new industry employment leaders come into prominence in a county. And job gains will not be seen equally in all industries, but for many it's clear that it's back to business as usual.
1U.S. Department of Agriculture, Census of Agriculture, 2012.
2Employment for some industry super-sectors was not available for all counties. This analysis selects the industries with the largest numeric job gains between 2007 and 2012 and the industries with the largest numeric job losses between 2007 and 2012, based on data that were available in both years.