By Dave Senf
May 2021
The number of new data sources providing novel measures of regional or state level economic activity has exploded over the last decade or so. Not only are there numerous new data sources but the ease of access to the data sources has also improved greatly, helping researchers in their quest to understand and explain how state or regional areas economies work and evolve. Here is a representative sample of the ongoing innovation in state and regional economic data.
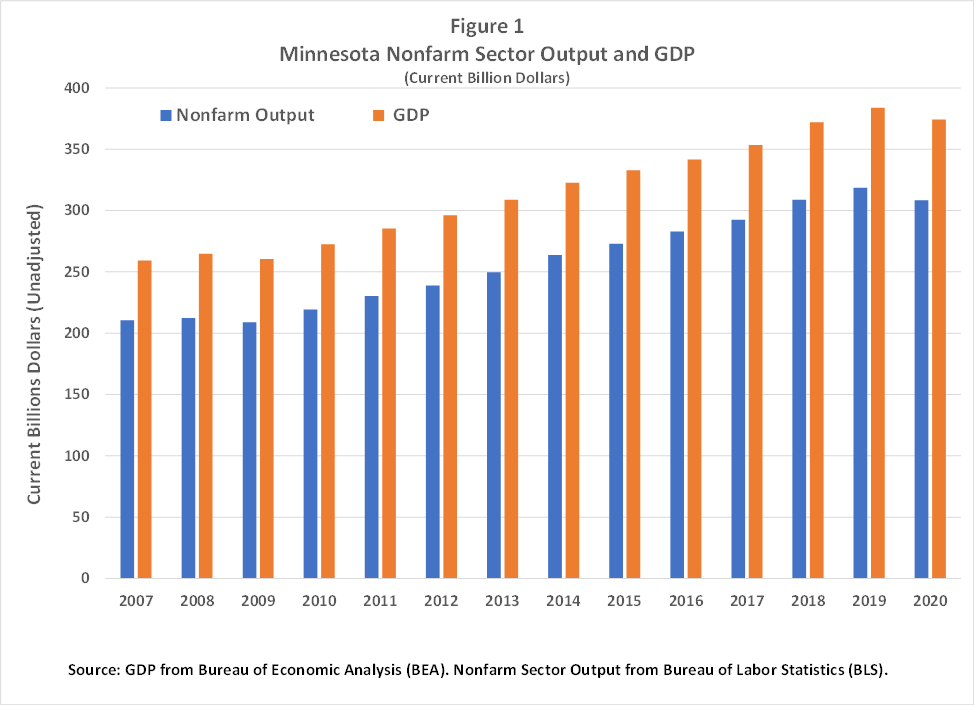
The most recent addition to novel state data useful in understanding how state economies differ and how state economies work is the BLS's experimental data on state level productivity.5 The state-level productivity dataset, covering 2007 to 2020, starts by adjusting BEA's state Gross Domestic Product (GDP) estimates to generate private nonfarm sector output levels in each state. Farm sector, private households, government sector, and owner-occupied housing imputed rental values are subtracted from GDP.6 State GDP estimates have been published by the BEA for over five decades and are designed to be equivalent to the national GDP.7 Figure 1 compares Minnesota's GDP and Nonfarm Sector Output (NSO) in nominal or current dollar estimates from 2007 to 2020. The exclusion of the farm sector, government sector, and owner-occupied housing services from NSO accounts for most of the difference in the two estimates. The gap in the two estimates hasn't varied much over the 2007 – 2020 period owing to little change in the relative contribution of the government and farm sectors and owner-occupied housing services to Minnesota's GDP. Nonfarm Sector Output has average between 80.2 and 83.1% of Minnesota's GDP over the 14 years of data.
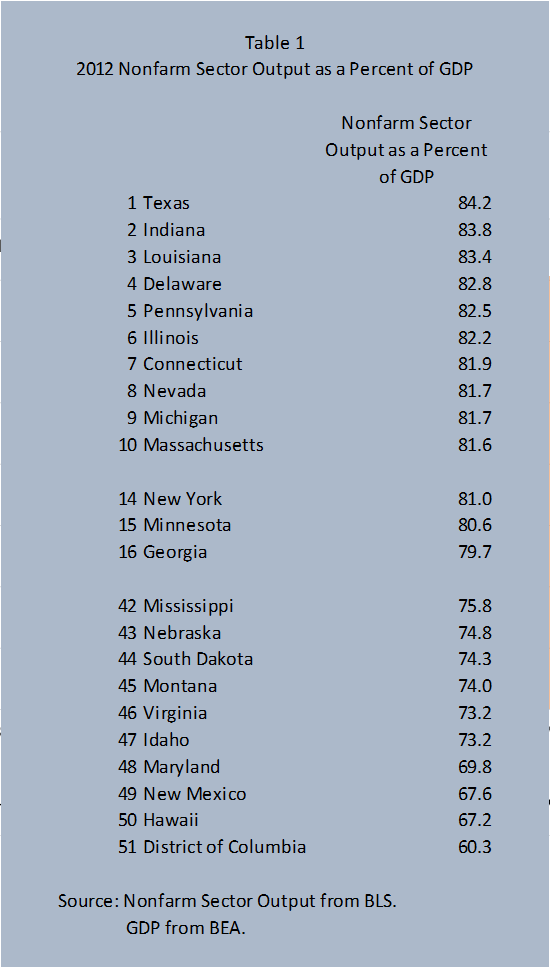
 The 2012 NSO estimate for Minnesota was 80.6% of the GDP estimate which was the 15th highest NSO as a percent of GDP across states (see Table 1). States which have a lot of federal employment (D.C., Virginia, Maryland) or economies where agricultural accounts for a relative high share of state economic activity (Montana, South Dakota, Nebraska) have smaller NSO estimates relative to GDP estimates.8 Developing accurate Nonfarm Sector Output estimates is important since NSO estimates divided by hours worked yields Hourly Value of Production (HVP) which when compared over time and adjusted for price changes produces an index of labor productivity for each state.
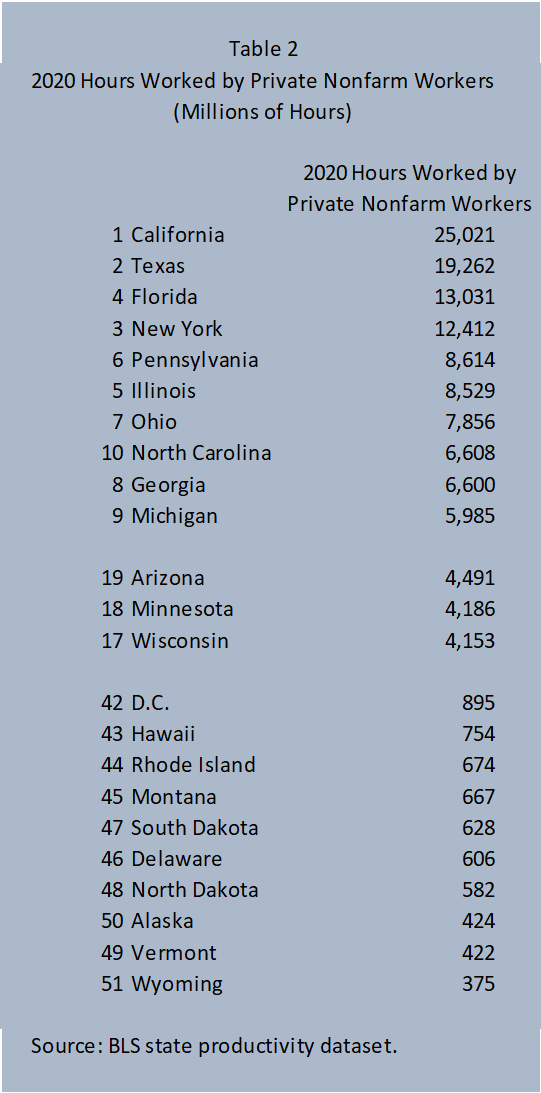
Annual hours worked in a state are based primarily on the Current Employment Statistics (CES) employment series. BLS started collecting average weekly hours in their monthly survey of business establishments in 2007 which data are primarily conducted to estimate monthly employment by industries. The CES hours data are adjusted to account for actual hours worked versus hours paid, thereby accounting for vacation and sick hours. Total hours worked by private nonfarm wage and salary workers is augmented with hours worked by self-employed workers and unpaid family workers with the hours data derived from the Current Population Survey (CPS). Minnesota's 4,186 million hours worked by private nonfarm sector workers in 2020 ranked 18th among states (see Table 2).
A state's total annual hours worked is obviously determined largely by how many workers are employed. Thus states with the largest employment base and population have the highest annual hours worked estimates. Variation in average weekly hours among states will also be a factor, but only a minor factor, since average weekly hours vary across states, but the variation is limited. Average weekly hours worked is mainly driven by the industry mix of a state. States with more manufacturing and mining tend to have higher average weekly hours. BLS includes annual employment totals in its state-productivity dataset from which average weekly hours worked can be calculated. Minnesota's average weekly hours worked for 2020 was 31.4 hours which was the 31st lowest average weekly hours worked estimate. Texas (33.1 hours) and Louisiana (32.9 hours) had the highest average weekly hours worked estimates while Montana (30.0 hours) and Delaware (29.9 hours) had the lowest.
BLS uses several price indices to convert nominal values to real values and to account for regional prices differences. The end results are measurements at the state-level for labor productivity, labor compensation, value of production, and labor costs that can be compared across time and states. For example, in Figure 2 Minnesota's Index of Labor Productivity, Real Hourly Value of Production and Real Hourly Labor Compensation are displayed. Real Hourly Value of Production advanced 16.9% from $50.96 to $59.60 between 2007 and 2020. Over the same period Real Hourly Compensation climbed 13.1% from $38.17 to $43.18. The real compensation – labor productivity gap (13.1% - 16.9%) between 2007-2020 growth in Minnesota parallels a long-term national trend where GDP has grown faster than wages. The gap, which is commonly known as labor shrinking share economic activity, has become a heated topic as the gap has widened since the 1970s.
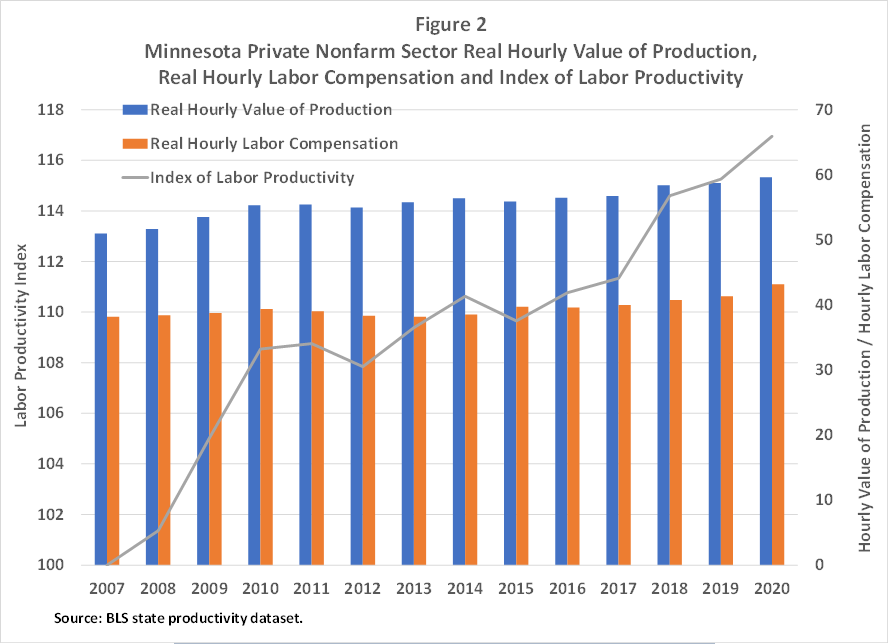
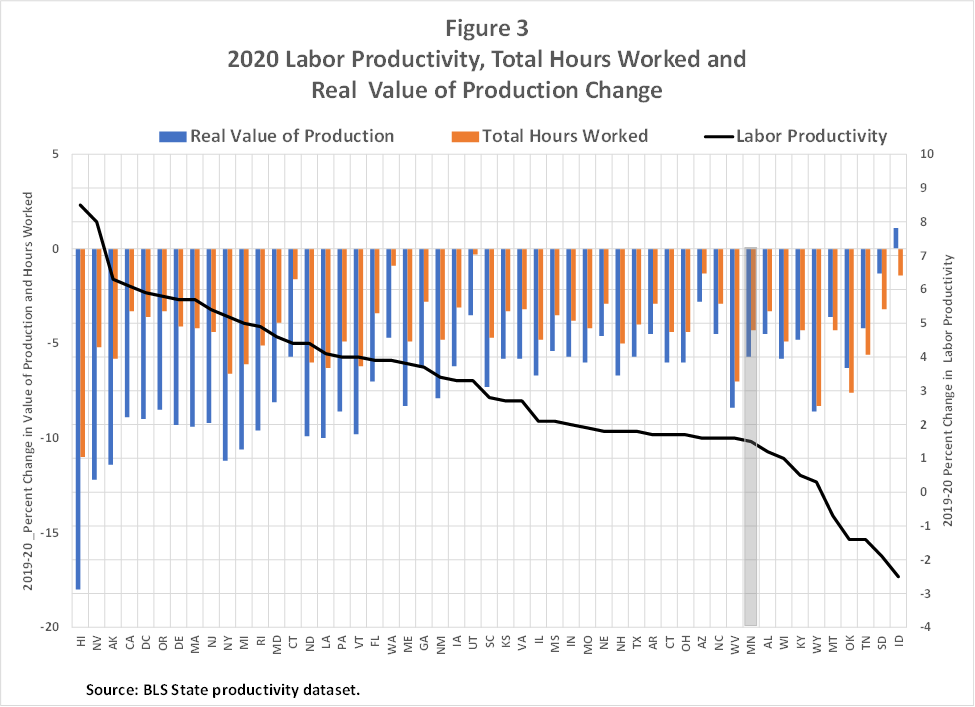
The year-to-year change in Real Hourly Value of Production is a measure of labor productivity. The Index of Labor Productivity normalizes Real Hourly Value of Production to the 2007 base year yielding an index of labor productivity. The 2010 Index of Labor Productivity value, 108.5, is just the Real Hourly Value of Production in 2010 divided by the 2007 value times 100 indicating that labor productivity increased 8.5% between 2007 and 2010. Minnesota's labor productivity has increased in 11 of the 13 years, declining only in 2012 and 2015. Labor productivity increased by 1.5% even in 2020 despite the real value of production slipping by 4.3% since annual hours worked slipped more, fading 5.7%. Labor productivity also rose during the middle of the Great Recession, increasing by 3.6% in 2009 as real value of production slumped 4.0% while hours worked tumbled 7.4%. Less production of goods and services but even less hours worked translates into a labor productivity gain.
That was true for 45 states and in D.C. in 2020 which was the highest number of states to record annual upticks in labor productivity since 50 states in 2010 (see Figure 3). Minnesota's 2020 labor productivity increase of 1.5% ranked towards the bottom among states recording labor productivity gains in 2020. Output fell in all 50 states and in D.C. last year, and hours worked dwindled in all states except Idaho (see Figure 3). Hours declined by less than output in Montana, Oklahoma, Tennessee, and South Dakota, triggering labor productivity declines in these states. Labor productivity also fell in Idaho as real production slipped while hours worked increased. Some of the data behind the labor productivity estimates will be revised over the next year or two so 2020 labor productivity estimates may also be revised.
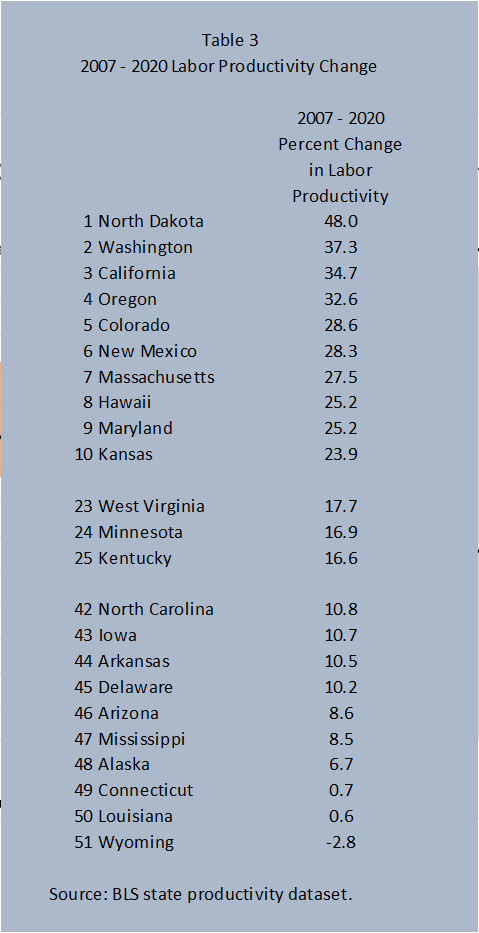 The 16.9% labor productivity increase achieved by Minnesota between 2007 and 2020 ranks in the middle of the pack. Our neighboring state, North Dakota, topped all states by a wide margin with a 48.0% increase. Wyoming and Louisiana had the smallest labor productivity change.
North Dakota's steep rise in productivity can be traced to its oil boom that started around 2006 and peaked in 2012. The boom in oil drilling and production boosted the value of the state's nonfarm sector value by much more than the related increase in hours worked in the oil fields since the value of production per hour worked in the oil industry is significantly higher than most other industries. Most labor productivity increases in North Dakota occurred between 2007 and 2014 before oil production leveled off as oil prices declined. The decline in oil prices from 2014-2020 also explains Wyoming's and Louisiana's bottommost ranking in labor productivity change over the last 13 year although the decline in coal production was also a factor in Wyoming. The strong labor productivity gains in states like Washington, California, Oregon, and Colorado are probably related to their higher-than-average share of output and employment in the Information and Communication Technology sector.
The importance of industrial mix to a state's labor productivity and by extension standard of living can be readily seen in BLS's just published state-level labor productivity data. Since labor force growth is expected to be very slow in Minnesota over the next few decades, any economic development teams would be wise to think about how labor productivity can be boosted by industries with high value of production.9
1See Longitudinal Employer-Household Dynamics.
2See Regional Price Parities by State and Metro Area.
3See Graduate Employment Outcomes.
4See Quarterly Employment Demographics.
5See Labor Statistics Productivity.
6Included in national and state GDP estimates are the services of owner-occupied housing (rent that homeowners would be paying if they didn't own their houses). The owner-occupied housing services account for roughly 6% of GDP but after the cost of maintaining a home are subtracted, net owner-occupied housing services account for between 2 and 3% or slightly less than the GDP contribution of the government sector.
7The BEA has recently published quarterly estimates of state GDP and annual county level GDP estimates. See Gross Domestic Product by State, 4th Quarter 2020 and Annual 2020 (Preliminary) and GDP by County, Metro, and Other Areas.
82012 is used to compare Nonfarm Sector Output as a percent of GDP since both estimates are published in 2012 based prices
9See these BLS's publications for more detail on their state-level labor productivity dataset: BLS publishes experimental state-level labor productivity measures and Productivity by State – 2023