by Luke Greiner and Mark Schultz
March 2019
Southwest Minnesota, like the rest of the state, is in the midst of a significant population shift as baby boomers get older and jump up to the next higher age brackets. The most recent estimates from the U.S. Census Bureau show that those age 55 and over make up almost one-third (32.3 percent) of the total population in the region, an increase of 24.1 percent from 2000. With this aging of the population, there is a subsequent impact on the labor force. Currently workers 55 and older make up 25.7 percent of the labor force, but will they become more engaged in the labor force than the current norms?
An estimated 13,600 workers 65 years or older are employed in southwest Minnesota’s labor force. The rate of participation in the labor force falls sharply beyond age 64. Roughly 70 percent of workers in the first half of their 60s are in the labor force, but less than a third of 65 to 74 year olds remain in the labor force, and less than 7 percent over 75 years are in the labor force. With a larger proportion of people already older in the region, as they continue to age, the labor force will decline in the coming decades.
Labor force projections from 2020 to 2030 show a predicted significant loss of residents between the ages of 55 to 64 equaling a decrease of about 10,860 workers, a drop of about 26.6 percent. In tandem, the number of labor force participants ages 65 and over are projected to increase by about 2,680, a jump of 16.1 percent. This is because people who are currently 55 to 64 years will be 65 and over in 10 years, so the change is from Baby Boomers aging from one part of the pyramid to another. Despite the projected increase of the oldest workers, many will exit the labor force entirely. Without a bulging population of younger workers to replace them, southwest Minnesota is expected to have 8,100 fewer workers by 2030. Essentially, this means more people will be in the oldest age group, but unless their labor force participation rates go upward rapidly, there won’t be enough new workers to replace the retirees.
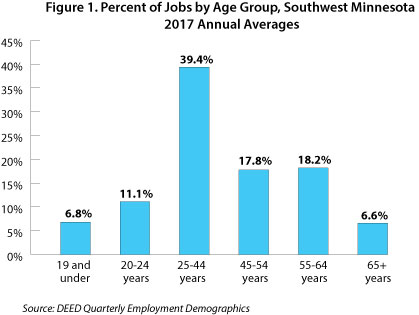
So what are older workers currently doing in the workforce? According to DEED’s Quarterly Employment Demographics data, across all industries there is an inverted “U” shaped trend which shows jobs peaking between the ages of 25 to 44 years before starting to turn downward (see Figure 1). It should be noted, however, that the age brackets which these data represent are not equal. For example, for the younger cohorts there is a five year bracket for individuals between the ages of 20 and 24, followed by a 20-year bracket consisting of those between the ages of 25 and 44 years, trailed by two 10-year brackets and then an “all other” category for those ages 65 and over. This explains the rather large representation in the middle of the distribution. There is also a higher representation among those between the ages of 55 and 64 compared to the younger cohort consisting of those between the ages of 45 and 54. The oldest age category, made up of those aged 65 and over, shows representation in the smallest percentage of jobs at 6.6 percent.
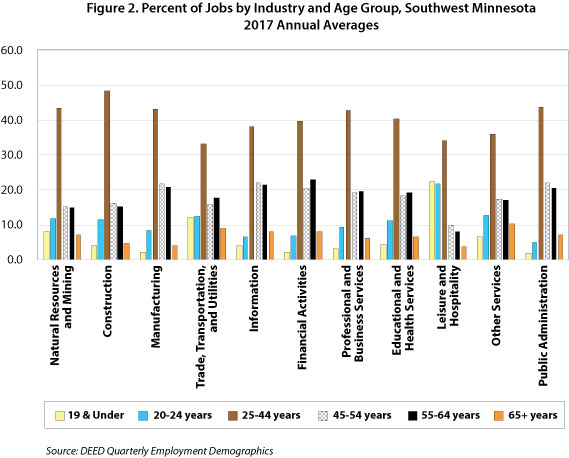
This, however, is just a general trend, and there is some variation depending on the industry. For example, as illustrated in Figure 2, workers between the ages of 55 and 64 hold anywhere from 8.1 to 22.9 percent of the jobs depending on the industry – 8.1 percent of the jobs in the Leisure and Hospitality supersector and 22.9 percent in the Financial Activities supersector. Those employees age 65 and over also occupy the lowest share (3.8%) of the jobs in Leisure and Hospitality, while holding the highest share (10.3 percent) of jobs in Other Services (Except Public Administration).
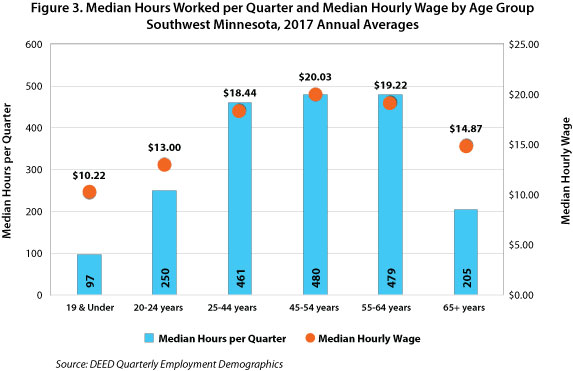
When we look at the median hours worked per quarter and median wages across industries and age groups, a similar pattern appears. The highest median wages are earned by those between the ages of 45 to 54, while a consistent decline in median hourly wages ensues as workers move up to older age brackets.
In addition to earning lower median hourly wages in general, older workers in the region are typically working fewer hours. As shown in Figure 3, the same general upside-down “U” trend occurs for median hours worked per quarter. Across all industries, however, those in the 55 to 64 age group worked only one hour less than their younger counterparts between the ages of 45 to 54, and they actually worked more than the three preceding younger age brackets. On the other hand, those ages 65 and over worked far fewer hours than all other age groups with the exception of those aged 19 and under.
Combining both lower hours worked and lower wages can equal large overall differences in total wages earned. For example, in the Professional and Business Services industry those ages 45 to 54 saw median quarterly hours worked resting at 480 with a median hourly wage of $24.28, equaling annual total earnings of about $11,654 per quarter or $46,618 annually. In comparison, those age 65 and over saw their median hours worked per quarter drop to 240 hours at $16.06 per hour, resulting in total quarterly earnings of $3,854 and annual earnings of $15,418. Overall, the older cohort in this particular example earned about $31,200 less annually, a decrease of about 67 percent.
Age plays a defining role in the changing needs workers have throughout life, but it also changes employers’ tactics to retain and recruit the most experienced workers in the economy. With fear of losing that experience and knowledge with each looming retirement, many companies are asking questions like "how can I keep employees who are eyeing retirement", and "where do I find retirees that might want to work again in some capacity".
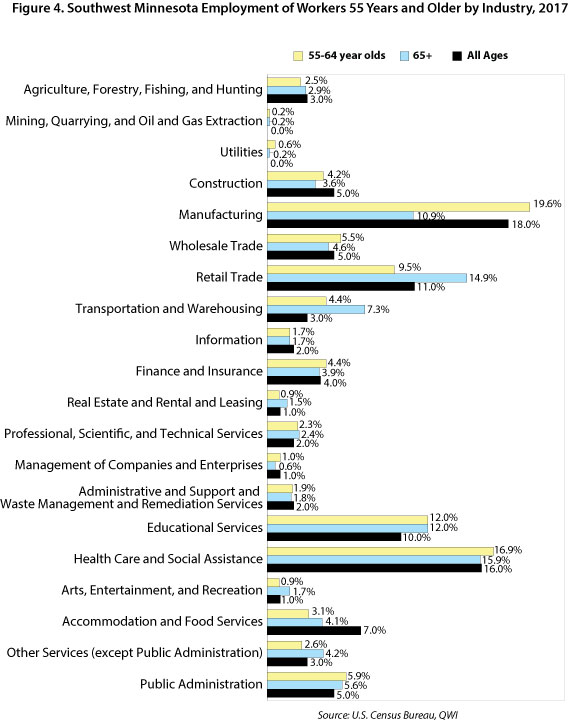
Understanding where and what the most experienced workers are currently doing is a reasonable starting point for making assumptions about their skills and motivations to work or retire. In southwest Minnesota workers 65 and older are most likely to be found in the Healthcare and Social Assistance industry, with 15.9 percent of workers 65 years and older employed in the industry. This might be expected since Healthcare and Social Assistance, along with Manufacturing, dominate the employment landscape in the region.
To find seniors working in Manufacturing, a slightly larger industry than Healthcare, is much less common after turning 65 than it is for 55- to- 64 year olds. It seems reasonable that many occupations in Manufacturing are simply too physically demanding for a number of workers 65 years and older, yet a smaller change is observed in the Construction industry, notorious for physically demanding tasks.
Conversely, it is more common for our oldest workers to be working in the Retail Trade industry, with about 15 percent of workers 65 and older working in Retail Trade compared to 9.5 percent for workers in the 55 to 64 year old age group.
One other possible reason for the steep decline in Manufacturing employment for the oldest workers compared to the increase in older workers in Retail Trade is that higher wages in Manufacturing provide the means for retirement, meaning many exit by choice. Annual wage data support this explanation with a strong correlation.
As noted above, income potential for workers tends to peak in the 45 to 54 year old cohort, and these high earning years can allow for increased savings for retirement. Every major industry whose average annual wages are less than the average for workers in their peak earning years, employs a larger share of workers 65 years and older than they do of workers 55 to 64. To put it another way, it becomes more common to find workers 65 years and older continuing to work if they are employed in a lower paying industry.
Public administration, an industry with a different structure, might further support the conclusion that exiting the labor force is a function of ability, not choice. Average wages in Public Administration in southwest Minnesota lag the average for all industries for each age cohort from 35 years and older. Yet, despite lower wages during peak earning years, a lower percentage of workers 65+ years remain employed in Public Administration compared to workers 55- to- 64 years old. Lower wages that can essentially keep workers with their employer beyond age 64 in other industries are potentially offset by defined benefit retirement plans that are commonplace in government at all levels.
It’s difficult to know how likely it is that retired workers looking for a second career would pursue employment in Retail Sales. Part-time work shifts, employee discounts, and modest entry level skill requirements could make this an attractive position for retirees looking for a change. But dealing with budget conscious consumers for relatively low pay can offer some interesting challenges.
According to Longitudinal Employer Household Dynamic (LEHD) data from the U.S. Census Bureau, 7 percent of southwest Minnesota workers who are 65 years and older have been recently hired. Recently is defined as they were recently hired and not working for the same employer at any time in the previous year. Workers 65 and older transitioned employers, potentially from a different industry, at higher rates in Agriculture, Accommodation and Food Service, and Administrative Support and Waste Management, mostly in the Employment Services subsector of Administrative Support which includes Staffing Agencies. Construction and Transportation also had slightly higher rates of newly hired workers who were 65 years or older.
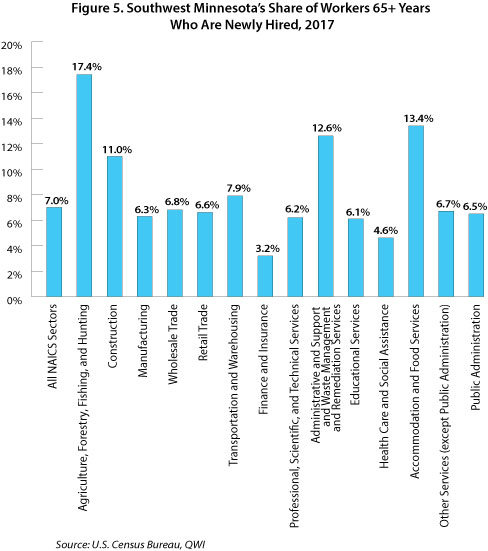
Three different scenarios can contribute to an uptick in the percentages found in Figure 5:
It’s difficult to pinpoint why there are large shares of newly hired seniors in some of the industries in Figure 5. The industries with low percentages of senior workers who are newly hired is possibly more revealing. We know that seniors are not finding new employment en masse at industries with lower percentages. So while workers 65 years and older are more likely to work in Retail than their slightly younger coworkers, it appears that it would be unlikely that many are finding new careers in the Retail Trade industry.
It’s certainly the case that some workers who have the means to retire simply won’t for their own self-fulfillment, but the data suggest that the main driving factor of why most workers continue working in their golden years is the financial ability or inability to retire. Strategies and programs that aim to target this experienced pool of labor should keep in mind the motivation of older workers. How job opportunities appeal to retirees and/or older workers might depend mainly on their past wages.