by Mohamed Mourssi-Alfash
March 2016
Both nationally and in Minnesota, people with disabilities are much less likely to be employed than people without disabilities and more likely to be living in poverty.
People with disabilities in Minnesota and nationally continue to encounter hardships in finding employment and earning sufficient income to support themselves and their families. This is despite regulations issued the past 50 years, including the Civil Rights Act of 1964 and the Americans with Disabilities Act of 1990. Recent census data indicate that people with disabilities have much higher unemployment rates and much lower labor force participation than the nondisabled population.
This article provides the most recent data on employment of people with disabilities in Minnesota and the U.S. and discusses the effectiveness of affirmative action policies over antidiscrimination regulations in bridging these employment gaps.
The 2014 American Community Survey (ACS) found that 13.1 percent of the U.S. population and 10.5 percent of the country's working-age population (ages 16 to 64) had at least one disability.1 In comparison, 11.2 percent of Minnesota's overall population and 8.9 percent of the state's working-age population had at least one disability (see Table 1).
| Disability Prevalence in the Total Population | |||
|---|---|---|---|
| Total Population | Total With Disability | Percent With Disability | |
| U.S. | 318,857,056 | 41,868,823 | 13.1% |
| Minnesota | 5,457,173 | 611,989 | 11.2% |
| Disability Prevalence in Working Age (16-64) Population | |||
| Population 16-64 | Disability 16-64 | Percentage With Disability | |
| U.S. | 207,450,305 | 21,875,663 | 10.5% |
| Minnesota | 3,548,949 | 314,170 | 8.9% |
| Source: American Community Survey, 2014 | |||
Working-age people with disabilities are significantly less likely to be employed than those without disabilities, both nationwide and in Minnesota. Minnesota, however, reported better rates than the nation in 2014 on measures of employment, unemployment and labor force participation for people with disabilities. Moreover, Minnesota reported slightly lower disparities between people with and without disabilities on these measures than nationwide in 2014.
As shown in Table 2, labor force participation among working-age people with disabilities in Minnesota was 46.8 percent, about 8.3 percentage points above the U.S. rate of 38.5 percent.
| Employment to Population Ratio in Working Age Population (16-64) | |||||
|---|---|---|---|---|---|
| Employed | Unemployed | Labor Force Participation Rate | Employment Ratio | Unemployment Rate | |
| Total Working Age Population | |||||
| Minnesota | 2,738,591 | 140,824 | 81.1% | 77.2% | 4.9% |
| U.S. | 141,366,597 | 11,237,715 | 73.6% | 68.1% | 7.4% |
| Working Age With Disability | |||||
| Minnesota | 131,707 | 15,202 | 46.8% | 41.9% | 10.3% |
| U.S. | 7,104,457 | 1,327,261 | 38.5% | 32.5% | 15.7% |
| Working Age Without Disability | |||||
| Minnesota | 2,606,884 | 125,622 | 84.5% | 80.6% | 4.6% |
| U.S. | 134,262,140 | 9,910,454 | 77.7% | 72.3% | 6.9% |
| Source: American Community Survey, 2014 | |||||
The employment ratio (percentage employed) for the same group in Minnesota was 41.9 percent in 2014, almost 10 percentage points over the national share of 32.5 percent. Yet, the employment rate for working-age people with disabilities was about half that of their counterparts without disabilities in Minnesota.
The unemployment rate for working-age people with disabilities in Minnesota was 10.3 percent in 2014, compared with 4.6 percent for people without disabilities. This gap is smaller than nationwide, where the comparable rates were 15.7 and 6.9 percent, respectively.
According to the 2010 Kessler Foundation report, nationwide "people with disabilities are more than twice as likely as people without disabilities (34 percent versus 15 percent) to report that they have a household income of $15,000 or less."2
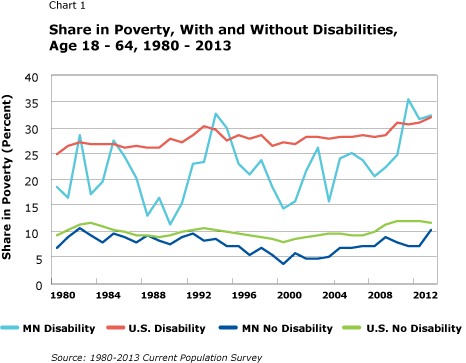
Likewise, Chart 1 shows poverty rates among people with disabilities in the working-age group from 1980 to 2013. In 2013 about 32.2 percent of the population with a disability in the working-age group in Minnesota was living below the poverty line, slightly higher than the U.S. rate of 31.9 percent. This is approximately three times the rate of poverty in the same age group without disabilities – 10.3 percent in Minnesota compared with 11.7 percent nationally. These high rates of poverty among working-age people with disabilities result from, among other things, high unemployment rates, low workforce participation rates and low rates of full-time, year-round employment.

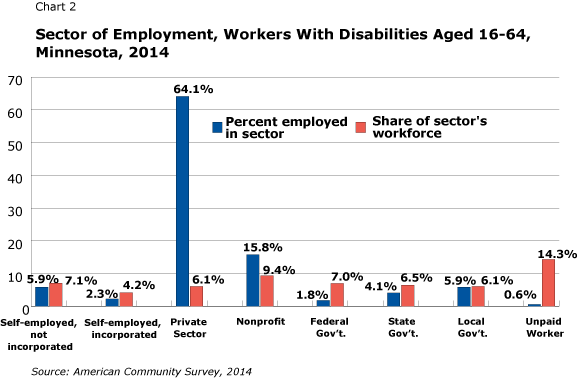
Chart 2 shows in what sectors working-age people with disabilities are employed in Minnesota (blue bars). The chart indicates that the majority of working people with a disability are employed in the private sector (64.1 percent), followed by the nonprofit sector (15.8 percent). In terms of the public sector, local government comes out on top (5.9 percent), followed by state government (4.1 percent) and federal government (1.8 percent).

Chart 2 also shows that 2.3 percent of people with disabilities have incorporated businesses, while 5.9 percent are self-employed in unincorporated businesses. This latter category represents much smaller enterprises. Moreover, an unknown share of these provide only supplementary income and could not be considered a primary income source. Less than 1 percent of working-age people with disabilities are unpaid workers who work for family, as volunteers or as unpaid interns.
Chart 2 also shows the share of each sector's workforce that is comprised of working-age people with disabilities (red bars). The chart indicates that the nonprofit sector has the highest share of its workforce comprised of people with disabilities at 9.4 percent. In the public sector, 6.5 percent of the workforce is comprised of people with disabilities, while 6.1 percent of the private sector is comprised of people with disabilities. In the self-employment category, people with disabilities own 4.2 percent of incorporated businesses and 7.1 percent of unincorporated businesses. The chart also shows that the unpaid worker sector has the highest concentration of working-age people with disabilities at 14.3 percent.
The 1964 Civil Rights Act, the 1973 Rehabilitation Act and the 1990 Americans with Disabilities Act (ADA) have achieved a great deal in setting rules and promoting employment for people with disabilities. People with disabilities, however, continue to struggle in the labor market.
Research shows that there are no significant differences in current employment levels, unemployment and wage levels among people with disabilities compared with their levels when Congress adopted the ADA in 1990.3
The major cause of the apparent failure of the ADA in achieving its employment goals was explained in a recent study by Myers and Sai (2014).4 Myers and Sai stressed that disability employment policies in the U.S. are ineffective anti-discrimination regulations, while policies in other countries, including China, include affirmative action policies that mandate hiring people with disabilities in all workforce sectors with pre-set mandatory goals, deadlines and directions.5 The Chinese government applies severe penalties against violators of these affirmative action policies. These different policy approaches have led to more significant improvements in disability employment in China than in the U.S.
Both the federal government and Minnesota took some steps to shift their policies toward affirmation action within the public sector through a number of executive orders and changes to existing laws. Although these policies are directive and not enforceable, they aim to impact only public sector-related employment. If implemented as intended, however, they could help to improve employment prospects for many people with disabilities and provide a model for private sector employers.
The following executive orders and laws demonstrate this movement toward affirmative action in disability employment policy:
President Clinton's Executive Order 13163: A decade after the ADA was adopted, there was evidence that qualified persons with disabilities were still being denied employment. President Bill Clinton signed Executive Order 13163 directing the addition of 100,000 individuals with disabilities to the federal government workforce over a five-year period.
President Obama's Executive Order 13548: In 2010 the U.S. celebrated the 20th anniversary of the ADA. As a result of continued high unemployment rates of people with disabilities, President Barack Obama signed Executive Order 13548 calling for the hiring of an additional 100,000 federal employees with disabilities over five years. The most recent reports from the U.S. Office of Personnel Management showed that the federal government made some progress in following Executive Order 13548. A 2012 report by the Government Accountability Office, however, indicated the federal government was not on track to fulfill the requirements of Executive Order 13548.
Section 503 of the Rehabilitation Act: In March 2014 the U.S. Department of Labor changed regulations for implementing Section 503 of the Rehabilitation Act. Section 503 now includes a rule to ensure that contractors doing business with the U.S. government reserve at least 7 percent of their jobs for people with disabilities.6
Gov. Dayton's Executive Order 14-14: Reports by Minnesota Management and Budget (MMB) showed that the percentage of state employees with disabilities dropped from 10 percent in 1999 to 3.7 percent in 2013.7 It was also found that the state workforce includes a smaller percentage of people with disabilities than neighboring states – 4.5 percent of Wisconsin's state workforce and 5 percent of Iowa's were comprised of people with disabilities. Gov. Mark Dayton issued Executive Order 14-14 directing state agencies to increase their hiring of people with disabilities to 7 percent by 2018. As a result, MMB reported an increase of 1 percent in the hiring of people with disabilities in the state workforce in 2014.
People with disabilities are still under-employed in Minnesota and nationwide. Even the advances made in recent years have proven to be insufficient to meet the needs of people with disabilities in the labor force. The federal and state governments realized the importance of shifting from anti-discrimination to a more affirmative action context, which is a significant move toward bridging the gap in disability employment. Moreover, Minnesota is in the process of launching numerous projects aimed at meeting the goals of executive orders. More remains to be accomplished to offer our citizens with disabilities the lives they deserve.
1U.S. Census Bureau, American Community Survey, 2014 American Community Survey One-Year Estimates. The American Community Survey defines disability prevalence as the percentage of people in the entire population who report at least one type of disability as defined by the federal government.
2Kessler Foundation (2010). Survey of Americans with Disabilities, "The ADA, 20 Years Later." Retrieved Nov. 25, 2015.
325 years after the ADA became law, the disabled continue to be absent from workforce.
4Myers, S. and Sai, D. (2014). "The Effects of Disability on Earnings in China and the United States," Review of Disability Studies, Vol. 9 (4), pp. 34-52.
5A Comparative Study on Disability Laws of China and the USA.
6Office of Federal Contract Compliance Programs Section 503.
7Minnesota Management and Budget (2014). State of Minnesota Workforce Report. Retrieved Nov 22, 2015.