by Nick Dobbins
July 2014
Income inequality has become a widely-discussed topic lately. The Occupy Wall Street movement in 2011 brought the country's attention to the growing divide between rich and poor. More recently, the bestseller Capital in the Twenty-First Century by economist Thomas Piketty argued that this divide will continue to worsen, concentrating wealth further among the rich and damaging the entire economy in the process. While the causes and importance of rising income inequality are too complex to discuss here, we can look at how evenly distributed income is in Minnesota when compared with the rest of the country.
A cursory glance at Table 1 suggests that income in Minnesota is dispersed more evenly than it is nationwide, as people making the 90th percentile wage here actually make slightly less than the national average, while lower-wage workers, including those at the low end of the income scale and the median earners, make markedly more than their national counterparts.
| Table 1: Average Wage by Income Level, First Quarter 2014 | ||||||
|---|---|---|---|---|---|---|
| Average (Mean) Wage | 10th Percentile Wage | 25th Percentile | 50th Percentile (Median) | 75th Percentile | 90th Percentile | |
| Minnesota | $23.00/hr | $8.97 | $11.79 | $18.15 | $28.52 | $42.89 |
| United States | $22.56/hr | $8.83 | $11.01 | $17.04 | $27.62 | $42.90 |
| Source: Occupational Employment and Wages Statistics, Minnesota Department of Employment and Economic Development | ||||||
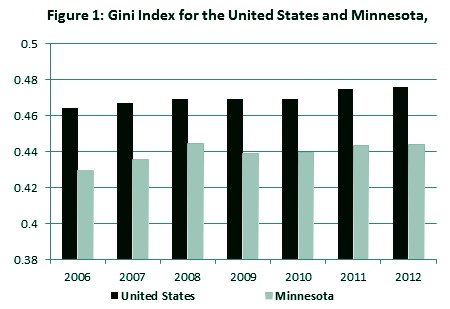
There are more specific ways than this to measure income distribution, and the most widely used of those is called the Gini index (or the Gini coefficient or ratio, depending on the source). The Gini index measures income distribution on a scale of 0 to 1, where zero represents perfect equality (everyone makes the same amount of money) and one represents perfect inequality (one person makes 100 percent of the money). As you can see in Figure 1, Minnesota has greater income equality than the nation as a whole. In fact, we have the 14th lowest Gini index in the country. It's worth noting, however, that rural states with smaller population bases, such as Wyoming and Alaska, seem to tend toward lower scores. Likewise, the biggest Gini indices tend to belong to states with high population density or those in the deep south, such as Washington D.C., New York, and Mississippi although these generalizations are far from constant, and there are multiple exceptions.1
To get another view of our standing, while attempting to account for population and geography, we compared the Minneapolis-St. Paul Metropolitan Statistical Area to a number of MSAs roughly similar in population size and in location.
| Metropolitan Statistical Area | Gini Index |
|---|---|
| Portland-Vancouver-Beaverton, OR-WA | 0.435 |
| Minneapolis-St. Paul-Bloomington, MN | 0.436 |
| Milwaukee-Waukesha-West Allis, WI | 0.448 |
| St. Louis, MO-IL | 0.449 |
| Indianapolis-Carmel, IN | 0.451 |
| Denver-Aurora-Broomfield, CO | 0.455 |
| Detroit-Warren-Livonia, MI | 0.457 |
| Cleveland-Elyria-Mentor, OH | 0.465 |
| Source: U.S. Census Bureau, 2007-2009 American Community Survey | |

As you also may have noticed in Figure 1, income inequality in both the United States and Minnesota is indeed growing. The Gini Index in the U.S. has grown from .397 in 1967 to .477 in 2012.2 Likewise, Minnesota's own Gini Index for families has grown from .361 in 1969 to .434 in 1999.3
For a more detailed look at wage inequality in Minnesota, see Amy Gehring's article in the January 2012 issue of Minnesota Employment Review or find it in our archives.
1United States Census Bureau, 2012 American Community Survey, 1-Year Estimates.
2U.S. Census Bureau, Historical Income Tables from the Current Population Survey, Annual Social and Economic Supplement.
3U.S. Census Bureau, 1970, 1980, 1990 and 2000 Decennial Censuses.