by Mark Schultz
June 2018

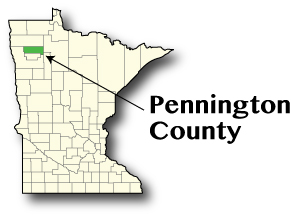
Pennington County was formed in 1910 and was named after Edmund Pennington, the vice president of the Minneapolis, St. Paul, and Sault Ste. Marie Railroad. The county is 616.6 square miles according to the U.S. Census and is one of the state's savanna region counties, composed of a larger amount of savanna soils compared to prairie or forest.
Pennington County experienced a growth of 654 residents from 2000 to 2017, an increase of 4.8 percent. With this population growth, the labor force in the county also saw an 18.7 percent increase during this time frame, a net gain of 1,435 people. Of the workers who live in the county, 1,603 leave the county for work elsewhere. The county, however, is a net importer of labor with 4,008 workers from outside the county commuting in for work. Marshall and Red Lake send the most non-residents into the county for work while the highest number of residents leave for Polk and Cass Counties for their jobs. From the current county population estimate of 14,238, the population is projected in increase by 360 (2.5 percent) by the year 2030. As the economy continues to tighten, the labor force is projected to see a decline with an estimated loss of 1,385 workers (down 15.2 percent).
Of the total industries within Pennington County, the top five make up 65.2 percent of the estimated 10,125 jobs in 415 firms. The largest employing industry is Wholesale Trade which accounts for over one-third of the total jobs itself (3,660 jobs in 30 establishments). Rounding out the top five industries in the county are Retail Trade (983 jobs at 71 firms), Manufacturing (958 jobs at 21 firms), Arts, Entertainment, and Recreation (531jobs at 11 firms), and Accommodation and Food Services (468 jobs at 29 firms).
In general, the county saw an 11.7 percent increase in jobs from 2010 to 2017, resulting in a gain of 1,074 jobs across all industries. The largest increases in jobs occurred in Wholesale Trade, (1,026 jobs) and Administrative and Support and Waste Management and Remediation Services (279 jobs), while Manufacturing (down 102 jobs) and Arts, Entertainment, and Recreation (down 56 jobs) saw the largest decreases, yet remained in the top five highest employing industries.
| Economy | ||
|---|---|---|
| Estimates | Pennington County | Minnesota |
| Population (2017 Annual Estimate) | 14,238 | 5,576,606 |
| Labor Force (4/2018) | 8,826 | 3,100,699 |
| Unemployment Rate (4/2018) | 4.9% | 3.1% |
| Household Income (2016) | $51,156 | $63,217 |
| Cost of Living Wage Requirement (Individual) | $12.06 | $15.22 |
| Cost of Living Wage Requirement (Average Family)* | $13.86 | $18.47 |
| Source: DEED Local Area Unemployment Statistics, DEED Cost of Living, U.S. Census American Community Survey
*Average Family: 2 parents, 1 full-time/1 part-time, 1 child |
||
| Industry | ||||
|---|---|---|---|---|
| Total 2017 Employment | Percent Change 2010-2017 | Average 2017 Annual Wages | Percent Change 2010-2017 | |
| Total, All Industries | 10,125 | 11.7% | $44,356 | 24.9% |
| Wholesale Trade | 3,661 | 38.9% | $54,340 | 16.5% |
| Retail Trade | 983 | -3.5% | $23,660 | 21.0% |
| Manufacturing | 958 | -9.6% | $41,860 | 1.5% |
| Arts, Entertainment, and Recreation | 531 | -9.5% | $19,396 | 13.7% |
| Accommodation and Food Services | 468 | 2.4% | $13,312 | 32.0% |
| Source: DEED Quarterly Census of Employment and Wages 2006-2016 | ||||

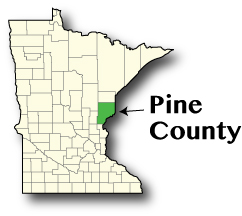
Pine County was formed in 1856 and covers 1,411 square miles containing many lakes and rivers that provide a copious amount of "scenic and recreational activities" according to the county web site. Interestingly, the county was featured in mystery novels written by Dean Hovey, which have received nominations for a Northeasters Minnesota Book Award for the effective portrayal of life in that part of the state.
Pine County experienced a growth of 2,673 residents from 2000 to 2017, an increase of 10.1 percent. With this population growth, the labor force in the county also saw an 11.8 percent increase during this time frame, a gain of 1,586 people. Of the workers who live in the county, 6,606 leave the county for work elsewhere, making the county a net exporter of labor. However, the county draws in 2,720 workers from outside the county who commute in for their jobs. The counties that send the most non-residents workers into Pine County are Kanabec and Chisago while Carlton and Hennepin counties see the highest number of Pine County residents commute in for work. While the county is currently home to 29,203 residents according to 2017 U.S. Census estimates, this number is projected to increase slightly by 2030, jumping 0.5 percent or 136 residents. Despite this increase in population the county is actually expected to see a labor force decline of over 2,700 workers by 2030, a drop of 18.2 percent.
Of the total industries within Pine County, the top five make up 72.1 percent of the estimated 8,342 jobs in 629 firms. The largest employing industry is Accommodation and Food Service which accounts for over one-quarter of the total jobs itself (2,332 jobs in 61 establishments). Rounding out the top five industries in the county are Retail Trade (1,036 jobs at 81 firms), Healthcare and Social Assistance (969 jobs at 49 firms), Educational Services (882 jobs at 15 firms), and Public Administration (801 jobs at 39 firms).
In general, the county saw a 1.3 percent increase in jobs from 2010 to 2017, resulting in a gain of 110 jobs across all industries. The largest increases in jobs occurred in Accommodation and Food Service (1,523 jobs) and Construction (166 jobs), while Arts, Entertainment, and Recreation (down 1,725 jobs) and Healthcare and Social Assistance (down 103 jobs) saw the largest decreases but remained in the top five highest employing industries).
| Economy | ||
|---|---|---|
| Estimates | Pine County | Minnesota |
| Population (2017 Annual Estimate) | 29,203 | 5,576,606 |
| Labor Force (4/2018) | 15,290 | 3,100,699 |
| Unemployment Rate (4/2018) | 5.9% | 3.1% |
| Household Income (2016) | $45,379 | $63,217 |
| Cost of Living Wage Requirement (Individual) | $15.44 | $15.22 |
| Cost of Living Wage Requirement (Average Family)* | $17.45 | $18.47 |
| Source: DEED Local Area Unemployment Statistics, DEED Cost of Living, U.S. Census American Community Survey
*Average Family: 2 parents, 1 full-time/1 part-time, 1 child |
||
| Industry | ||||
|---|---|---|---|---|
| Total 2017 Employment | Percent Change 2010-2017 | Average 2017 Annual Wages | Percent Change 2010-2017 | |
| Total, All Industries | 8,342 | 1.3% | $31,096 | 15.4% |
| Accommodation and Food Services | 2,332 | 188.3% | $22,672 | 96.4% |
| Retail Trade | 1,036 | 5.5% | $22,152 | 22.1% |
| Healthcare and Social Assistance | 969 | -9.6% | $29,536 | 16.9% |
| Educational Services | 882 | 0.8% | $40,716 | 14.6% |
| Public Administration | 801 | 4.8% | $48,308 | 11.1% |
| Source: DEED Quarterly Census of Employment and Wages 2006-2016 | ||||

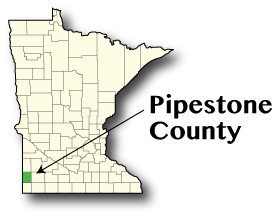
Established in 1857, Pipestone County had previously experienced explorers and traders visiting the county. People deferred settlement in the county, however, because they saw it as "Indian territory". The name Pipestone came about because the county is home to accumulations of red pipestone that Native Americans in the area used to create pipes. The county is home to a prime example of the "skilled (architectural) craftsmanship and beauty" in the state with the county courthouse, which is characterized by a 100-foot "renaissance dome", atop which rests a bronze statue of "Justice".
Pipestone County, unfortunately, experienced a population decline of 8.2 percent from 2000 to 2017, equaling 808 fewer residents. Not surprisingly, accompanying this population decline was a decrease in the labor force, which fell from 5,421 in 2000 to 4,821 in 2017 - a drop of 600 workers (11.1 percent). The county experiences a higher number of residents leaving the county for work than they see non-residents coming in for work – 2,026 residents leave while only 1,653 non-residents commute in from outside. The highest number of non-residents come in from Murray and Rock Counties while the largest number of Pipestone County residents travel to Minnehaha in South Dakota and Lyon Counties for work. Currently home to 9,087 residents, the county is anticipated to see an overall decline in population of almost 960 people or 10.5 percent by 2030 and, as the labor market continues to tighten, the labor force is also projected to see a decrease of almost 700 workers by then, a drop of 14.4 percent.
Of the total industries within Pipestone County, the top five make up just under three-quarters (74.9 percent) of the estimated 4,497 jobs in 354 firms. The largest employing industry is Education and Health Services which makes up over one-quarter (26.4 percent) of the jobs in the county. Trade, Transportation, and Utilities comes in second with 925 jobs in 99 establishments, followed by Manufacturing (508 jobs in 14 firms), Natural Resources and Mining (412 jobs in 33 firms), and Construction (337 jobs in 56 firms).
In general, the county saw a 1.3 percent increase in jobs from 2010 to 2017, resulting in a gain of 210 jobs across all industries. The largest increases in jobs occurred in Construction, which gained 193 jobs, and Natural Resources and Mining, which saw an increase of 118 jobs. Of the five industries that saw job declines, the highest occurred in Leisure and Hospitality (down 83 jobs) and Education and Health Services (down 79). Despite the loss in jobs from 2010 to 2017, Education and Health Services remained in the top five highest employing industries.
| Economy | ||
|---|---|---|
| Estimates | Pipestone County | Minnesota |
| Population (2017 Annual Estimate) | 9,087 | 5,576,606 |
| Labor Force (4/2018) | 5,098 | 3,100,699 |
| Unemployment Rate (4/2018) | 3.6% | 3.1% |
| Household Income (2016) | $48,944 | $63,217 |
| Cost of Living Wage Requirement (Individual) | $13.51 | $15.22 |
| Cost of Living Wage Requirement (Average Family)* | $14.66 | $18.47 |
| Source: DEED Local Area Unemployment Statistics, DEED Cost of Living, U.S. Census American Community Survey
*Average Family: 2 parents, 1 full-time/1 part-time, 1 child |
||
| Industry | ||||
|---|---|---|---|---|
| Total 2017 Employment | Percent Change 2010-2017 | Average 2017 Annual Wages | Percent Change 2010-2017 | |
| Total, All Industries | 4,497 | 4.9% | $37,076 | 35.3% |
| Education and Health Services | 1,186 | -6.2% | $31,824 | 15.9% |
| Trade, Transportation, and Utilities | 925 | -4.7% | $32,986 | 31.0% |
| Manufacturing | 508 | 8.1% | $41,756 | 20.8% |
| Natural Resources and Mining | 412 | 40.1% | $39,728 | 16.5% |
| Construction | 337 | 134.0% | $51,064 | 52.0% |
| Source: DEED Quarterly Census of Employment and Wages | ||||

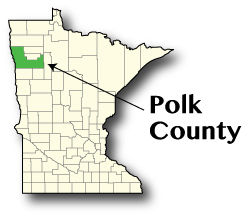
Named after the 11th U.S. President, James Polk, Polk County came to be in 1858, but was not officially organized until 1872-73. Polk County is ranked number one in the production of three crops - spring wheat, dry beans, and sugar beets – according to the Minnesota Department of Agriculture. The county is also home to two national wildlife refuges – Glacial Ridge and Rydell.
Polk County experienced a rather small population gain from 2000 to 2017 with an increase of only 250 people (0.8 percent). However, during this time frame the labor force saw a more sizable increase, growing by 7.3 percent (1,158 people). Just under 50 percent, 49.8 to be exact, of the county's residents leave the county to work in nearby counties, which equals an exodus of about 7,870 residents. However, the county also draws in about 4,870 non-residents to work in jobs in the county. In fact, the largest number of workers who commute into the county actually come from Grand Forks County in North Dakota, with the second largest number of commuters come in from Red Lake County, MN. Of the county residents who go elsewhere to work, over one-half (51.4 percent or 4,048 residents) commute to Grand Forks County, ND, while another 4.9 percent (770) are employed in Cass County, ND.
Of the total industries within Polk County, the top five make up almost 65 percent (64.1) of the estimated 12,258 jobs in 965 firms. The largest employing industry is Healthcare and Social Assistance which accounts for 19.8 percent of the jobs in the county. Rounding out the top five industries in the county are Manufacturing (1,693 jobs in 41 firms), Educational Services (1,424 jobs in 27 firms), Retail Trade (1,289 jobs in 95 firms), and Accommodation and Food Services (1,020 jobs in 67 firms).
In general, the county saw job growth of less than 1 percent (0.7) from 2010-2017, which amounted to 82 additional jobs across all industries. Manufacturing, which jumped by 205 during this time, saw the largest increase in jobs, and Agriculture, Forestry, Fishing, and Hunting saw the second highest job gain with 118. However, while remaining in the top five industries in the county, Healthcare and Social Assistance actually saw the highest decrease in jobs, dropping by 226, followed by Professional, Scientific, and Technical Services which decreased by 70 jobs.
| Economy | ||
|---|---|---|
| Estimates | Polk County | Minnesota |
| Population (2017 Annual Estimate) | 31,619 | 5,576,606 |
| Labor Force (4/2018) | 17,214 | 3,100,699 |
| Unemployment Rate (4/2018) | 4.1% | 3.1% |
| Household Income (2016) | $53,059 | $63,217 |
| Cost of Living Wage Requirement (Individual) | $13.53 | $15.22 |
| Cost of Living Wage Requirement (Average Family)* | $15.31 | $18.47 |
| Source: DEED Local Area Unemployment Statistics, DEED Cost of Living, U.S. Census American Community Survey
*Average Family: 2 parents, 1 full-time/1 part-time, 1 child |
||
| Industry | ||||
|---|---|---|---|---|
| Total 2017 Employment | Percent Change 2010-2017 | Average 2017 Annual Wages | Percent Change 2010-2017 | |
| Total, All Industries | 12,258 | 0.7% | $39,000 | 25.4% |
| Health Care and Social Assistance | 2,428 | -8.5% | $40,456 | 49.9% |
| Manufacturing | 1,693 | 13.8% | $53,768 | 24.1% |
| Educational Services | 1,424 | 2.2% | $41,392 | 9.5% |
| Retail Trade | 1,289 | 4.1% | $23,972 | 21.0% |
| Accommodation and Food Services | 1,020 | -3.7% | $13,988 | 39.4% |
| Source: DEED Quarterly Census of Employment and Wages | ||||