By Dave Senf
September 2013
Per capita personal income in Minnesota is rising again after plunging during the Great Recession, but there is still lost ground to recover.
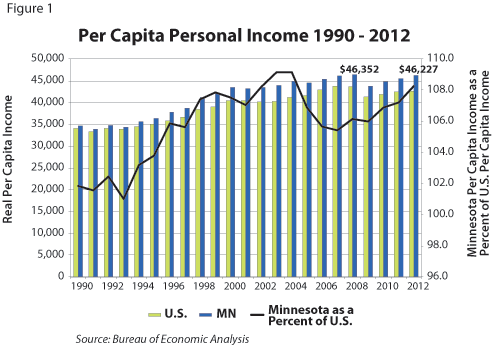
Per capita personal income in Minnesota continued to rebound last year, increasing for the third straight year to an all-time high of $46,227 after plunging 5.8 percent (down $2,500) in 2009. That's the good news. The bad news is that after adjusting for inflation, per capita income in Minnesota last year was 0.3 percent or $125 below the record unadjusted high reached in 2008 (see Figure 1).1
Real personal income in Minnesota spiraled downward in 2009, driven by a combination of job losses, reduced work hours, delayed raises, wage cuts, bonus suspensions, lower interest income, declining farm income and slipping dividend payouts. While many of those factors have reversed direction since then, helping to boost real per capita income over the last three years, there is still lost ground to recover. The distribution of income sources for Minnesotans has not completely returned to the pre-recession mix, nor has the income distribution across households bounced back to the distribution of five years ago.
Personal income (especially per capita personal income), as compiled and reported by the Bureau of Economic Analysis (BEA), is widely used to compare and evaluate the economic well-being of states, metro areas and counties.2 The major drawback is that it has little to say about the distribution of income across individuals or households. Median household income, produced by the U.S. Census Bureau's American Community Survey (ACS), is another widely used state or regional income measure that provides the distribution side of an area's income picture.3 Median household income, as well as other income measures produced by the Census Bureau, however, are released less frequently, come out later than BEA's personal income data, and provide significantly less detail about the sources of personal income.
Minnesota's real median household income, unlike per capita personal income, has shown no signs of rebounding, at least through 2011. Real median income declined 5.9 percent between 2007 and 2011 in Minnesota and by 8.2 percent nationwide. More current estimates of U.S. median household income from another source (Current Population Survey) show median household income bottomed out in 2011, followed by gradual but uneven improvement over the last 18 months. It remains well below pre-recession levels, however. Median household income in Minnesota is likely to show an increase for 2012 when the data are released this fall, but the increase will still leave median household income in Minnesota below pre-recession levels, as is the case nationally.
Minnesota's personal income, on the other hand, has nearly rebounded to pre-recession levels over the last three years, but the distribution of the income gains has been uneven, leaving many Minnesota households economically behind where they were before the Great Recession.
Minnesota's per capita personal income has grown faster over the last few years than the national rate. It soared during the 1990s and early 2000s compared with the rest of the country, peaking at 9.2 percent higher (or roughly $3,800 more income per person in Minnesota than nationally) in 2003 and 2004. The state's advantage slipped some during the mid-2000s but has been rising again since the recession (see Figure 1).

Minnesota's share of the nation's private wage and salary disbursements, wage and salary supplements, and farm income has increased over the last three years. Minnesotans' share of other income sources, like public sector wage and salary disbursements, interest and dividend income, and transfer payment income have remained constant since the recession. The net result is that Minnesota's per capita personal income relative to the U.S. level rose to an eight-year high last year.
The BEA's personal income measure is a more comprehensive measure of income than the various measures of family or household income measured by the Census Bureau. BEA's income estimates are designed to be consistent with national income and product accounts used to estimate gross domestic product. The largest source of income is private nonfarm wage and salary disbursements, better known as paychecks, tips and bonuses received by Minnesota's 2.1 million private sector workers.
Real private paychecks nosedived 7 percent from 2007 to 2009. Dividends, interest and rent (collectively termed property income) plunged even more during the two-year recessionary period, dropping nearly 16 percent. Nonfarm proprietors' income also plummeted when the recession hit, tumbling 14 percent. Nonfarm proprietors' income is the income earned by self-employed Minnesotans, excluding farmers and ranchers.
Personal income from the above three sources declined by a combined $17.7 billion between 2007 and 2009. That huge income drop was partially offset by a substantial jump in personal current transfer receipts, which included some of the federal spending generated by the 2008 Economic Stimulus Act. Transfer receipts or payments climbed $6.6 billion over the two years as federal spending across various programs soared in Minnesota and nationally. Five programs accounted for three-fourths of the rise in transfer payment income in Minnesota: Social Security benefits, other income maintenance benefits, Medicare benefits, Medicaid payments and unemployment insurance checks.4
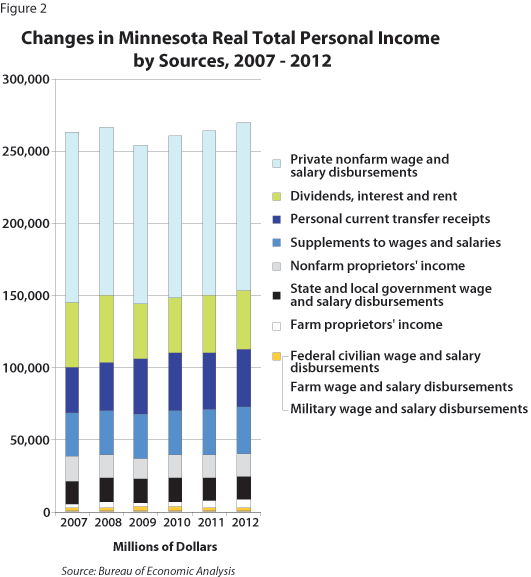
Figure 2 displays the relative importance and changes in Minnesota's income sources from 2007 to 2012. Private wage and salary payments have bounced backed since 2009 but not completely. Interest, dividend and rent income has started to grow again but remains significantly below five years ago. Nonfarm proprietors' income has also snapped back but is still short of pre-recession levels.

Transfer receipts have leveled off over the two years but remain elevated from 2007. Many of the transfer programs that rose during the recession, such as unemployment insurance payments, have declined over the last few years as the economy has improved. Other transfer payments, however, will continue to increase as the number of baby boomers collecting Social Security checks and signing up for Medicare mounts.
State and local government wage and salary payments, which rose slightly during the recession, actually decreased over the last few years, leaving public sector pay 2 percent lower in 2012 than in 2007. Wage and salary supplements (private and public employer-paid benefits such as health insurance and pension contributions) continued to climb even during the recession.
One significant source of income growth during the recovery that will likely wane in the future is farm income. Farm income, termed farm proprietors' income here, doubled between 2007 and 2012, climbing from $2.1 billion to $5.5 billion. Minnesota farmers had a bumper year in 2012, capturing 7.5 percent of nationwide farm income, their second highest share ever, topped only by the 7.8 percent attained in 1977. The good fortunes of Minnesota farmers last year increased Minnesota's personal per capita income by $452. That extra income pushed per capita personal income from 7.2 to 8.2 percent above the national average.
The combined paychecks of the five wage and salary disbursements displayed in Figure 2 add up to roughly $135 billion for 2012, or half of the money that is counted in total personal income by the BEA for the year. Last year's paycheck was $3.6 billion higher than in 2009 but still $2.5 billion short of the 2007 combined paycheck. Detailed BEA sector and industry wage and salary data for 2012 have yet to be published, but 2012 wage and salary data from the Quarterly Census of Employment and Wages (QCEW) program have been released and can be utilized to track wage and salary shifts in more detail.5
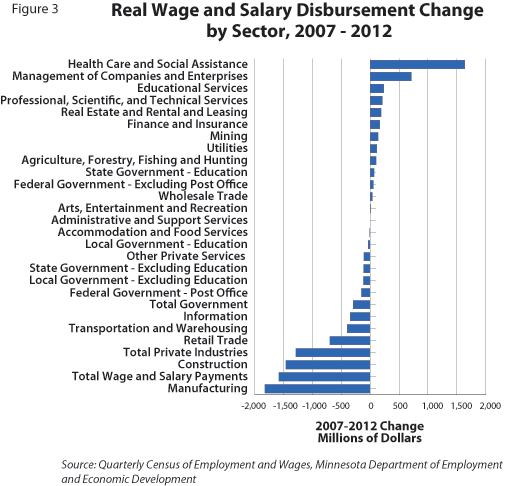
Since wage rates in most industries have been flat over the last five years, wage and salary payment gains and losses across sectors mostly mirror job gains and losses across sectors. Payroll numbers were hit hard in manufacturing and construction during the recession and have only partially recovered since. Health care and social assistance employment, on the other hand, slowed for a time during the recession but ramped up soon after the recovery was underway.
As a result, health care and social assistance wage and salary payments were $1.6 billion higher in 2012 than in 2007. Wage and salary payments in manufacturing were $1.8 billion below their 2007 level in 2012, while construction wage and salary income was down $1.5 billion over the five-year period (see Figure 3).

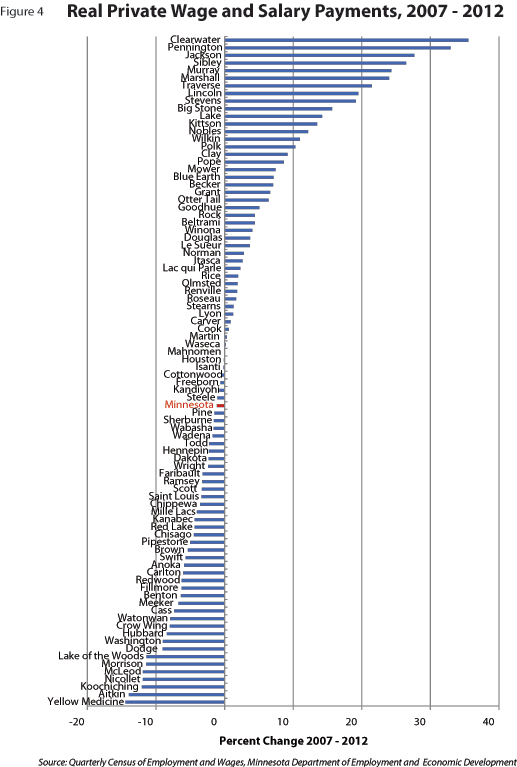
QCEW data can also show where wage and salary payments have recovered or are still below pre-recession levels across the state. Private wage and salary payments in Minnesota as measured by QCEW were 1.1 percent lower in 2012 than 2007. Private wage and salary income was higher over the five-year period, however, in 42 counties. A majority of the counties with positive wage and salary growth are in western Minnesota. The seven core counties of the Twin Cities are among the 45 counties with private wage and salary income still below pre-recession levels (see Figure 4).

Per capita personal income in Minnesota has rebounded faster from the Great Recession than nationally, but a closer look at the various sources of income included in personal incomes reveals that there is still plenty of lost ground to be recovered for many income sources, industries and areas.
1All income data presented here have been adjusted to 2012 dollars using the Consumer Price Index - All Urban Consumer (CPI-U).
3Median household income from the American Community Survey.
4Other income maintenance benefits consists largely of general assistance; expenditures for food under the Special Supplemental Nutrition Program for Women, Infants, and Children (WIC); Other Needs Assistance; refugee assistance; foster home care and adoption assistance; the 2008 Economic Stimulus Act Rebates; Earned Income Tax Credits; Child Tax Credits; American Recovery and Investment Act-funded tax credits; other tax credits; and energy assistance.
5QCEW data. QCEW is used by the BEA to calculate their wage and salary disbursement estimates. BEA wage and salary totals usually exceed QCEW wage and salary totals by 4 percent because the BEA makes adjustment to account for employment not included in QCEW and for under-reporting of wages and salaries.