by Mark Schultz
August 2014
As the summer months roll on, we as Minnesotans feel the frustration of the seemingly endless labyrinths that road construction projects create with closed roads and detours. While stress may build in many of us, we can find comfort in the fact that the construction industry, in addition to new roads, is projected to continue building jobs in the years to come despite decreasing during the Great Recession. This growth not only includes road and bridge construction, but residential and non-residential building construction, utility system construction, and building equipment and finishing contractors as well.
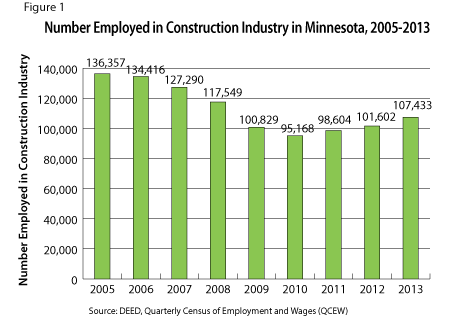
As seen in Figure 1, the number of jobs in the construction industry in Minnesota started to decline in 2006, reaching its lowest point in 2010, right in the middle of the Great Recession. Since 2010, there has been a strong increase of anywhere from 3,000 to 6,000 jobs in this industry in the last four years, ending with 107,433 jobs statewide in 2013. While this is approximately 20 percent less than in 2005, it is a 13 percent increase from 2010.

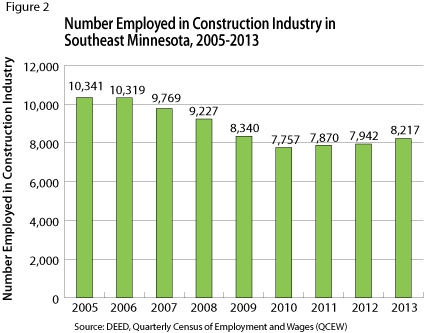
Southeast Minnesota showed a similar pattern with a 20 percent drop in construction jobs since 2005, but a 6 percent increase from the low point in 2010 to 2013 (Figure 2). After peaking at 10,341 workers in 2005, the number of construction jobs in Southeast Minnesota fell as low as 7,757 in 2010, before gaining back nearly 500 jobs through 2013. According to DEED's Quarterly Census of Employment and Wages (QCEW) program, there were 1,444 construction firms providing 8,217 jobs in Southeast Minnesota with total annual payroll of just under $394 million in 2013.

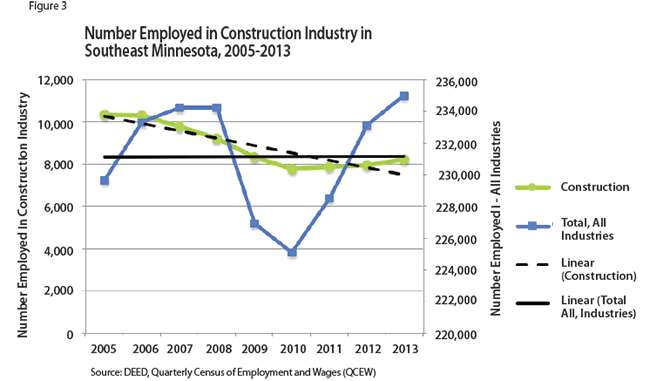
The construction industry had a consistent downward trend compared to the relatively stable trend for all industries from 2005 to 2013. Figure 3 illustrates this with trend lines based on the gains and losses to both over this eight-year period. The difference in trends between the total of all industries (solid line) and that of the construction industry (dashed line) shows a general upward trend for all industries despite a steep decline and a rapid resurgence; while construction saw a modest decline overall. These trends show that while total employment is back to pre-recession levels across all industries, the construction industry has not yet fully recovered.

Many of the sectors within the construction industry in Southeast Minnesota saw similar declines in the number employed from 2005 to 2013. Residential and non-residential1 building construction; highway, street and bridge construction; foundation, structure and building exterior contractors; building equipment contractors; and building finishing contractors all saw a decline in employment ranging from just under 10 percent for building equipment contractors to just over 40 percent for foundation, structure, and building finishing contractors.
With the loss of employment in all but one of the sectors in the construction industry, this period was also characterized by a loss in the number of establishments providing these services. Foundation, structure, and building finishing contractors declined the most in total number of establishments lost (115) and percentage of the total establishments lost (33.1 percent).
Between 2005 and 2010 the construction industry in Southeast Minnesota lost 2,584 jobs, wiping out gains from previous years. Then from 2011 to 2013, the region saw an increase of 460 jobs from the low of 7,757 construction jobs in 2010. Only the utility system construction sector had more jobs than it had in 2005, with a modest increase of 40 (10.5 percent) jobs from 2005 to 2013.
Table 1 shows Southeast Minnesota's construction establishments, employment, and average weekly wages in 2013 as well as the changes in average annual employment, number of establishments, and average weekly wages since 2005. The construction industry dropped 2,124 jobs, or just over 20 percent, from 2005 to 2013, and the number of construction establishments dropped by 275, a 16 percent decline. Residential building construction and foundation, structure, and building exterior contractors suffered the largest job losses with 384 and 577 jobs lost, as well as 76 and 115 establishments lost, respectively, during this period.
| Average Annual Employment, Establishments and Weekly Wages for Construction Sectors in Southeast Minnesota, 2005-2013 | ||||||
|---|---|---|---|---|---|---|
| Occupation | Employment 2013 | Employment Change 2005-2013 | Establishments 2013 | Establishment Change 2005-2013 | Weekly Wages 2013 | Wage Change 2005-2013 |
| Construction (Total) | 8,217 | -2,124 (-20.5%) | 1,444 | -275 (-16.0%) | $916 | +$191 (+26.3%) |
| Residential Building Construction | 669 | -384 (-36.5%) | 308 | -76 (-19.8%) | $574 | +$14 (+2.5%) |
| Non-Residential Building Construction | 946 | -140 (-12.9%) | 70 | -6 (-7.9%) | $930 | +$129 (+16.1%) |
| Utility System Construction | 421 | +40 (+10.5%) | 30 | -7 (-18.9%) | $1,153 | +$405 (+33.9%) |
| Highway, Street, and Bridge Construction | 1,093 | -186 (-14.5%) | 53 | -7 (-11.7%) | $1,202 | +$304 (+33.9%) |
| Foundation, Structure, and Building Exterior Contractors | 826 | -577 (-41.1%) | 232 | -115 (-33.1%) | $684 | +$128 (+23.0%) |
| Building Equipment Contractors | 2,842 | -287 (-9.2%) | 347 | -32 (-8.4%) | $1,004 | +$186 (+22.7%) |
| Building Finishing Contractors | 657 | -454 (-40.9%) | 167 | -61 (-26.8%) | $712 | +$122 (+20.7%) |
| Source: DEED: QCEW | ||||||
These numbers may seem bleak, but there is a positive aspect — average annual weekly wages saw an increase of anywhere from 2.5 percent for residential building construction to 33.9 percent for both utility building construction and highway, street, and bridge construction. In fact, four of the sectors in the construction industry — non-residential building construction, utility system construction, highway, street, and bridge construction, and building equipment contractors — had significantly higher average weekly wages than that of $843 for the total of all industries.
Job seekers may wonder when the region will regain all the jobs lost during the Great Recession, but DEED's projections paint a brighter future for the construction industry. While the construction industry has seen a general negative trend over the past nine years, there is reason for residents of Southeast Minnesota to be optimistic. According to DEED's Employment Outlook data tool, construction occupations and architecture and engineering occupations in Southeast Minnesota are projected to see gains of 4,170 and 1,020 jobs, respectively in the next decade. This includes 1,920 replacement openings — new workforce entrants to replace workers who leave an occupation — in construction and 730 replacement openings in architecture and engineering.
In addition to these fast-growing construction occupations, jobs in the transportation and material moving occupational group are also projected to grow in the years to follow. For example, conveyor operators and tenders, crane and tower operators, excavating and loading machine and dragline operators, and industrial truck and tractor operators are all projected to have increased employment opportunities in Southeast Minnesota (Table 2).
| High Growth Construction-Related Occupations in Southeast Minnesota | |||||||
|---|---|---|---|---|---|---|---|
| Occupational Title | Estimated 2010 Employment | Projected Employment 2020 | Projected 2020 Percent Change | Numeric Change 2010 - 2020 | Replacement Openings | Total Openings | Median Salary (Hourly) |
| Drafters, Engineering Technicians and Mapping Technicians | 1,448 | 1,500 | 3.6% | 52 | 280 | 380 | $23.73 |
| Supervisors of Construction and Extraction Workers | 613 | 766 | 25% | 153 | 140 | 290 | $30.56 |
| Construction Trades Workers | 6,982 | 8,937 | 28% | 1,955 | 1,520 | 3,480 | $21.89 |
| Carpenters | 1,610 | 1,945 | 20.8% | 335 | 340 | 680 | $20.06 |
| Operating Engineers and Other Construction Equipment Operators | 722 | 896 | 24.1% | 174 | 170 | 340 | $21.60 |
| Electricians | 1,116 | 1,553 | 39.2% | 437 | 300 | 740 | $26.51 |
| Painters, Construction and Maintenance | 463 | 552 | 19.2% | 89 | 100 | 190 | $19.79 |
| Plumbers, Pipefitters and Steamfitters | 798 | 1,176 | 47.4% | 378 | 230 | 610 | $31.19 |
| Construction Laborers | 828 | 948 | 14.5% | 120 | 70 | 190 | $15.83 |
| Other Construction and Related Workers | 755 | 805 | 6.6% | 50 | 200 | 250 | $20.85 |
| Highway Maintenance Workers | 479 | 490 | 2.3% | 11 | 130 | 140 | $20.72 |
| Conveyor Operators and Tenders | 153 | 168 | 9.8% | 15 | 40 | 60 | $16.74 |
| Crane and Tower Operators | 31 | 36 | 16.1% | 5 | 10 | 10 | $15.32 |
| Excavating and Loading Machine and Dragline Operators | 50 | 72 | 44.0% | 22 | 20 | 40 | $18.30 |
| Industrial Truck and Tractor Operators | 1,119 | 1,295 | 15.7% | 176 | 320 | 500 | $16.81 |
| Source: DEED Employment Outlook (Projections) | |||||||
Despite the huge hit the construction industry took during the Great Recession, both in the state and specifically in the Southeast Region, it appears that it will build its way back up in its future. Not only has there been an increase in employment in this industry since the depths of the recession, but it appears that this trend will continue for many years to come. DEED projections are showing a promising future for occupations in the construction and material moving industries, with some large numbers of job openings and above-average wages that will help Southeast Minnesota's construction workers live comfortably.
1Non-residential includes industrial and commercial and institutional construction.